SunTrust 2013 Annual Report Download - page 79
Download and view the complete annual report
Please find page 79 of the 2013 SunTrust annual report below. You can navigate through the pages in the report by either clicking on the pages listed below, or by using the keyword search tool below to find specific information within the annual report.-
 1
1 -
2
-
3
-
4
-
5
-
6
-
7
-
8
-
9
-
10
-
11
-
12
-
13
-
14
-
15
-
16
-
17
-
18
-
19
-
20
-
21
-
22
-
23
-
24
-
25
-
26
-
27
-
28
-
29
-
30
-
31
-
32
-
33
-
34
-
35
-
36
-
37
-
38
-
39
-
40
-
41
-
42
-
43
-
44
-
45
-
46
-
47
-
48
-
49
-
50
-
51
-
52
-
53
-
54
-
55
-
56
-
57
-
58
-
59
-
60
-
61
-
62
-
63
-
64
-
65
-
66
-
67
-
68
-
 69
69 -
 70
70 -
 71
71 -
 72
72 -
 73
73 -
 74
74 -
 75
75 -
 76
76 -
 77
77 -
 78
78 -
 79
79 -
 80
80 -
 81
81 -
 82
82 -
 83
83 -
 84
84 -
 85
85 -
 86
86 -
 87
87 -
 88
88 -
 89
89 -
90
-
91
-
92
-
93
-
94
-
95
-
96
-
97
-
98
-
99
-
100
-
101
-
102
-
103
-
104
-
105
-
106
-
107
-
108
-
109
-
110
-
111
-
112
-
113
-
114
-
115
-
116
-
117
-
118
-
119
-
120
-
121
-
122
-
123
-
124
-
125
-
126
-
127
-
128
-
129
-
130
-
131
-
132
-
133
-
134
-
135
-
136
-
137
-
138
-
139
-
140
-
141
-
142
-
143
-
144
-
145
-
146
-
147
-
148
-
149
-
150
-
151
-
152
-
153
-
154
-
155
-
156
-
157
-
158
-
159
-
160
-
161
-
162
-
163
-
164
-
165
-
166
-
167
-
168
-
169
-
170
-
171
-
172
-
173
-
174
-
175
-
176
-
177
-
178
-
179
-
180
-
181
-
182
-
183
-
184
-
185
-
186
-
187
-
188
-
189
-
190
-
191
-
192
-
193
-
194
-
195
-
196
-
197
-
198
-
199
-
200
-
201
-
202
-
203
-
204
-
205
-
206
-
207
-
208
-
209
-
210
-
211
-
212
-
213
-
214
-
215
-
216
-
217
-
218
-
219
-
220
-
221
-
222
-
223
-
224
-
225
-
226
-
227
-
228
-
229
-
230
-
231
-
232
-
233
-
234
-
235
-
236
 |
 |
63
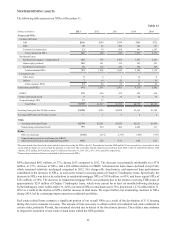
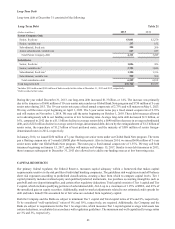
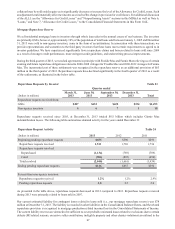
Long-Term Debt
Long-term debt at December 31 consisted of the following:
Long-Term Debt Table 21
(Dollars in millions) 2013 2012
Parent Company Only
Senior, fixed rate $3,001 $2,270
Senior, variable rate 283 152
Subordinated, fixed rate 200 200
Junior subordinated, variable rate 627 627
Total Parent Company debt 4,111 3,249
Subsidiaries
Senior, fixed rate 1,006 426
Senior, variable rate 13,783 3,846
Subordinated, fixed rate 21,300 1,336
Subordinated, variable rate 500 500
Total subsidiaries debt 6,589 6,108
Total long-term debt $10,700 $9,357
1 Includes $256 million and $286 million of debt recorded at fair value at December 31, 2013 and 2012, respectively.
2 Debt recorded at fair value.
During the year ended December 31, 2013, our long-term debt increased $1.3 billion, or 14%. The increase was primarily
due to the issuances of $600 million of 10-year senior notes under our Global Bank Note program and $750 million of 5-year
senior notes during 2013. The 10-year senior notes pay a fixed annual coupon rate of 2.75% and will mature on May 1, 2023.
We may call the notes at par beginning on April 1, 2023. The 5-year senior notes pay a fixed annual coupon rate of 2.35%
and will mature on November 1, 2018. We may call the notes beginning on October 1, 2018. These debt issuances allowed
us to advantageously add to our funding sources at low borrowing rates. Average long-term debt decreased $1.9 billion, or
16%, compared to 2012 due to a $1.1 billion decline in average senior debt, a $640 million decrease in average subordinated
debt, and a $222 million decline in average senior foreign-denominated debt, driven by the extinguishment of $1.2 billion of
senior notes, the repurchase of $1.2 billion of trust preferred notes, and the maturity of $589 million of senior foreign-
denominated notes in 2012, respectively.
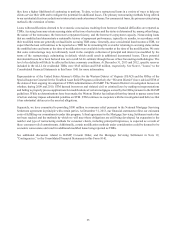
In January 2014, we issued $250 million of 3-year floating rate senior notes under our Global Bank Note program. The notes
pay a floating coupon rate of 3-month LIBOR plus 44 basis points. Also in January 2014, we issued $600 million of 3-year
senior notes under our Global Bank Note program. The notes pay a fixed annual coupon rate of 1.35%. We may call both
issuances beginning on January 15, 2017, and they will mature on February 15, 2017. Similar to our debt issuances in 2013,
these issuances subsequent to December 31, 2013 also allowed us to add to our funding sources at low borrowing rates.
CAPITAL RESOURCES
Our primary federal regulator, the Federal Reserve, measures capital adequacy within a framework that makes capital
requirements sensitive to the risk profiles of individual banking companies. The guidelines risk weight assets and off-balance
sheet risk exposures according to predefined classifications, creating a base from which to compare capital levels. Tier 1
capital primarily includes realized equity and qualified preferred instruments, less purchase accounting intangibles such as
goodwill and core deposit intangibles, and certain other regulatory deductions. Total capital consists of Tier 1 capital and Tier
2 capital, which includes qualifying portions of subordinated debt, ALLL up to a maximum of 1.25% of RWA, and 45% of
the unrealized gain on equity securities. Additionally, mark-to-market adjustments related to our estimated credit spreads for
debt and index linked CDs accounted for at fair value are excluded from regulatory capital.
Both the Company and the Bank are subject to minimum Tier 1 capital and Total capital ratios of 4% and 8%, respectively.
To be considered “well-capitalized,” ratios of 6% and 10%, respectively, are required. Additionally, the Company and the
Bank are subject to requirements for the Tier 1 leverage ratio, which measures Tier 1 capital against average total assets less
certain deductions, as calculated in accordance with regulatory guidelines. The minimum and well-capitalized leverage ratios
are 3% and 5%, respectively.