SunTrust 2013 Annual Report Download - page 59
Download and view the complete annual report
Please find page 59 of the 2013 SunTrust annual report below. You can navigate through the pages in the report by either clicking on the pages listed below, or by using the keyword search tool below to find specific information within the annual report.-
 1
1 -
2
-
3
-
4
-
5
-
6
-
7
-
8
-
9
-
10
-
11
-
12
-
13
-
14
-
15
-
16
-
17
-
18
-
19
-
20
-
21
-
22
-
23
-
24
-
25
-
26
-
27
-
28
-
29
-
30
-
31
-
32
-
33
-
34
-
35
-
36
-
37
-
38
-
39
-
40
-
41
-
42
-
43
-
44
-
45
-
46
-
47
-
48
-
 49
49 -
 50
50 -
 51
51 -
 52
52 -
 53
53 -
 54
54 -
 55
55 -
 56
56 -
 57
57 -
 58
58 -
 59
59 -
 60
60 -
 61
61 -
 62
62 -
 63
63 -
 64
64 -
 65
65 -
 66
66 -
 67
67 -
 68
68 -
 69
69 -
70
-
71
-
72
-
73
-
74
-
75
-
76
-
77
-
78
-
79
-
80
-
81
-
82
-
83
-
84
-
85
-
86
-
87
-
88
-
89
-
90
-
91
-
92
-
93
-
94
-
95
-
96
-
97
-
98
-
99
-
100
-
101
-
102
-
103
-
104
-
105
-
106
-
107
-
108
-
109
-
110
-
111
-
112
-
113
-
114
-
115
-
116
-
117
-
118
-
119
-
120
-
121
-
122
-
123
-
124
-
125
-
126
-
127
-
128
-
129
-
130
-
131
-
132
-
133
-
134
-
135
-
136
-
137
-
138
-
139
-
140
-
141
-
142
-
143
-
144
-
145
-
146
-
147
-
148
-
149
-
150
-
151
-
152
-
153
-
154
-
155
-
156
-
157
-
158
-
159
-
160
-
161
-
162
-
163
-
164
-
165
-
166
-
167
-
168
-
169
-
170
-
171
-
172
-
173
-
174
-
175
-
176
-
177
-
178
-
179
-
180
-
181
-
182
-
183
-
184
-
185
-
186
-
187
-
188
-
189
-
190
-
191
-
192
-
193
-
194
-
195
-
196
-
197
-
198
-
199
-
200
-
201
-
202
-
203
-
204
-
205
-
206
-
207
-
208
-
209
-
210
-
211
-
212
-
213
-
214
-
215
-
216
-
217
-
218
-
219
-
220
-
221
-
222
-
223
-
224
-
225
-
226
-
227
-
228
-
229
-
230
-
231
-
232
-
233
-
234
-
235
-
236
 |
 |
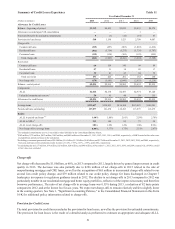
43
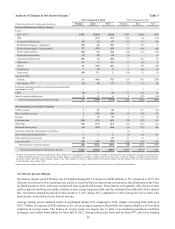
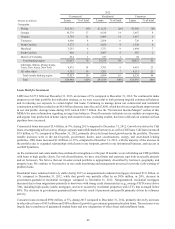
Noninterest income decreased $2.2 billion, or 40%, during 2013 compared to 2012, driven by a $2.0 billion decrease in net
securities gains primarily due to the sale of our Coke common stock in 2012, which was part of our Form 8-K items in 2012.
Excluding the impact of Form 8-K items from 2013 and 2012, noninterest income decreased $621 million, or 16%, during
2013 compared to 2012. The decrease was driven by a decline in mortgage-related revenue as a result of a decline in production
volume and lower gain on sale margins and a decline in net MSR hedge performance. Partially offsetting the decrease was
higher wealth management and capital markets revenue, as well as a decline in the mortgage repurchase provision and mark-
to-market valuation losses on our fair value debt and index-linked CDs in 2013 compared to 2012. See Table 36, "Reconcilement
of Non-U.S. GAAP Measures - Annual," in this MD&A for a reconciliation of noninterest income, excluding Form 8-K items.
Other charges and fees decreased $33 million, or 8%, during 2013 compared to 2012. The decrease was primarily due to
lower insurance premium income due to a reduction of mortgage reinsurance agreements and lower letter of credit and loan
commitment fee income.
Retail investment services income increased $26 million, or 11%, during 2013 compared to 2012 due to fixed and variable
annuity sales and growth in managed accounts. Investment banking income increased $14 million, or 4%, during 2013
compared to 2012. The increase was primarily driven by growth in merger and acquisition advisory and equity transaction
fee revenue, as well as syndication and bond origination activity.
Trading income decreased $29 million, or 14%, compared to 2012. The decrease was primarily due to lower core trading
income impacted by higher interest rates and a reduction in trading-related reserves in 2012. These declines were partially
offset by a $69 million decline in mark-to-market valuation losses on our fair value debt and index-linked CDs.
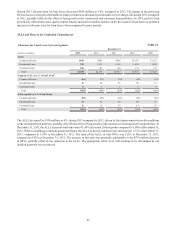
Mortgage production related income decreased $29 million, or 8%, during 2013 compared to 2012 due to a decline in production
volume, compression of gain on sale margins, and lower lock volume associated with a drop in applications, partially offset
by a lower mortgage repurchase provision. Excluding the Form 8-K items, mortgage production income declined 47% primarily
due to the aforementioned reasons. The reduction in gain on sale margins was a result of industry competition. Applications
decreased 35% during 2013 compared to 2012 and loan production volume decreased 7% from the prior year to $29.9 billion,
both due to a decline in loan refinance activity as a result of the increase in interest rates during the year. Mortgage production
during 2013 was comprised of approximately 64% in refinance activity, but refinance production decreased 16% compared
to 2012. However, during 2013, loan purchase production increased 16%, and we expect further growth in purchase production
in 2014, though it will not offset an expected decline in refinance activity during 2014.
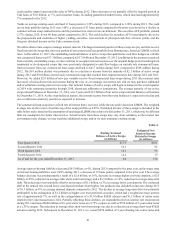
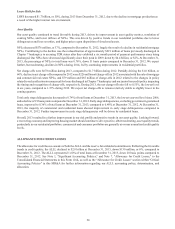
During 2013, the mortgage repurchase provision was $114 million, a decrease of $599 million compared to 2012. The lower
provision was predominantly driven by the $371 million increase to the mortgage repurchase reserve in the third quarter of
2012, which was the result of information received during 2012 from the GSEs and our experience related to demands, both
of which enhanced our ability to estimate losses related to remaining expected demands on foreclosed and currently delinquent
pre-2009 GSEs loan sales. During 2013, we reached agreements with Freddie Mac and Fannie Mae under which Freddie Mac
and Fannie Mae released us from certain existing and future repurchase obligations for loans sold to Freddie Mac between
2000 and 2008 and Fannie Mae between 2000 and 2012. While the majority of both repurchase settlements was covered by
our existing mortgage repurchase reserve, we increased the provision during 2013 by $63 million as a result of these settlements,
as the population of loans included under the agreements was broader than the population of loans considered under our
existing mortgage repurchase reserve. The reserve for mortgage repurchases was $78 million at December 31, 2013, a decrease
of $554 million from December 31, 2012, resulting from the recognition of losses on resolved repurchase requests and the
recognition of certain legacy mortgage matters during the year, which included payments to Freddie Mac and Fannie Mae
under the settlement agreements. However, the 2013 agreements with Fannie Mae and Freddie Mac settling certain aspects
of our repurchase obligations preserve their right to require repurchases arising from certain types of events, and that
preservation of rights can impact our future losses. While the repurchase reserve includes the estimated cost of settling claims
related to required repurchases, our estimate of losses depends on our assumptions regarding GSE and other counterparty
behavior, loan performance, home prices, and other factors. For additional information on the mortgage repurchase reserve,
see Note 17, "Guarantees," to the Consolidated Financial Statements in this Form 10-K and the "Critical Accounting Policies"
section in this MD&A. See Part I., "Item 1A. Risk Factors," in this Form 10-K for further information regarding our potential
for additional liability.
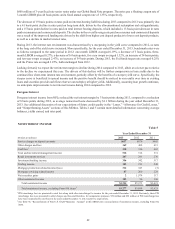
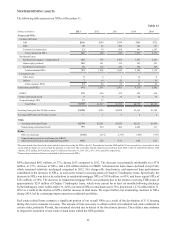
Mortgage servicing related income decreased $173 million, or 67%, during 2013 compared to 2012. The decrease was primarily
due to less favorable net MSR hedge performance, an increase in the decay of the servicing asset, and a smaller servicing
portfolio resulting in lower servicing fees. Net MSR hedge performance is highly sensitive to the market interest rate
environment, which became volatile and increased during 2013. As a result of the higher and more volatile interest rate
environment, our hedge became only slightly accretive to income during 2013. The increase in decay of the servicing asset
was due to the elevated level of refinance volume during the first half of 2013, prior to the reduction in refinance activity
during the second half of 2013 due to higher interest rates. At December 31, 2013, the servicing portfolio was $136.7 billion