SunTrust 2013 Annual Report Download - page 89
Download and view the complete annual report
Please find page 89 of the 2013 SunTrust annual report below. You can navigate through the pages in the report by either clicking on the pages listed below, or by using the keyword search tool below to find specific information within the annual report.-
 1
1 -
2
-
3
-
4
-
5
-
6
-
7
-
8
-
9
-
10
-
11
-
12
-
13
-
14
-
15
-
16
-
17
-
18
-
19
-
20
-
21
-
22
-
23
-
24
-
25
-
26
-
27
-
28
-
29
-
30
-
31
-
32
-
33
-
34
-
35
-
36
-
37
-
38
-
39
-
40
-
41
-
42
-
43
-
44
-
45
-
46
-
47
-
48
-
49
-
50
-
51
-
52
-
53
-
54
-
55
-
56
-
57
-
58
-
59
-
60
-
61
-
62
-
63
-
64
-
65
-
66
-
67
-
68
-
69
-
70
-
71
-
72
-
73
-
74
-
75
-
76
-
77
-
78
-
 79
79 -
 80
80 -
 81
81 -
 82
82 -
 83
83 -
 84
84 -
 85
85 -
 86
86 -
 87
87 -
 88
88 -
 89
89 -
 90
90 -
 91
91 -
 92
92 -
 93
93 -
 94
94 -
 95
95 -
 96
96 -
 97
97 -
 98
98 -
 99
99 -
100
-
101
-
102
-
103
-
104
-
105
-
106
-
107
-
108
-
109
-
110
-
111
-
112
-
113
-
114
-
115
-
116
-
117
-
118
-
119
-
120
-
121
-
122
-
123
-
124
-
125
-
126
-
127
-
128
-
129
-
130
-
131
-
132
-
133
-
134
-
135
-
136
-
137
-
138
-
139
-
140
-
141
-
142
-
143
-
144
-
145
-
146
-
147
-
148
-
149
-
150
-
151
-
152
-
153
-
154
-
155
-
156
-
157
-
158
-
159
-
160
-
161
-
162
-
163
-
164
-
165
-
166
-
167
-
168
-
169
-
170
-
171
-
172
-
173
-
174
-
175
-
176
-
177
-
178
-
179
-
180
-
181
-
182
-
183
-
184
-
185
-
186
-
187
-
188
-
189
-
190
-
191
-
192
-
193
-
194
-
195
-
196
-
197
-
198
-
199
-
200
-
201
-
202
-
203
-
204
-
205
-
206
-
207
-
208
-
209
-
210
-
211
-
212
-
213
-
214
-
215
-
216
-
217
-
218
-
219
-
220
-
221
-
222
-
223
-
224
-
225
-
226
-
227
-
228
-
229
-
230
-
231
-
232
-
233
-
234
-
235
-
236
 |
 |
73
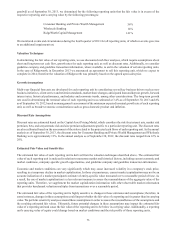
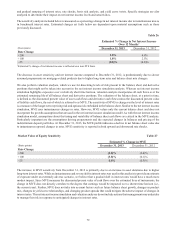
goodwill as of September 30, 2013, we determined for the following reporting units that the fair value is in excess of the
respective reporting unit's carrying value by the following percentages:
Consumer Banking and Private Wealth Management 56%
Wholesale Banking 14%
RidgeWorth Capital Management 141%
We monitored events and circumstances during the fourth quarter of 2013 for all reporting units, of which no events gave rise
to an additional impairment test.
Valuation Techniques
In determining the fair value of our reporting units, we use discounted cash flow analyses, which require assumptions about
short and long-term net cash flow, growth rates for each reporting unit, as well as discount rates. Additionally, we consider
guideline company and guideline transaction information, where available, to aid in the valuation of certain reporting units.
In the case of Ridgeworth, in December 2013 we announced an agreement to sell this reporting unit, which we expect to
complete in 2014; therefore the valuation of Ridgeworth was primarily based on the agreed upon sales price.
Growth Assumptions
Multi-year financial forecasts are developed for each reporting unit by considering several key business drivers such as new
business initiatives, client service and retention standards, market share changes, anticipated loan and deposit growth, forward
interest rates, historical performance, and industry and economic trends, among other considerations. The long-term growth
rate used in determining the terminal value of each reporting unit was estimated at 3.4% as of September 30, 2013 and 4%
as of September 30, 2012, based on management's assessment of the minimum expected terminal growth rate of each reporting
unit, as well as broader economic considerations such as gross domestic product and inflation.
Discount Rate Assumptions
Discount rates are estimated based on the Capital Asset Pricing Model, which considers the risk-free interest rate, market risk
premium, beta, and unsystematic risk and size premium adjustments specific to a particular reporting unit. The discount rates
are also calibrated based on the assessment of the risks related to the projected cash flows of each reporting unit. In the annual
analysis as of September 30, 2013, the discount rates for Consumer Banking and Private Wealth Management and Wholesale
Banking were approximately 13%. In the annual analysis as of September 30, 2012, the discount rates ranged from 12% to
20%.
Estimated Fair Value and Sensitivities
The estimated fair value of each reporting unit is derived from the valuation techniques described above. The estimated fair
value of each reporting unit is analyzed in relation to numerous market and historical factors, including current economic and
market conditions, company-specific growth opportunities, and guideline company and guideline transaction information.
Economic and market conditions can vary significantly which may cause increased volatility in a company's stock price,
resulting in a temporary decline in market capitalization. In those circumstances, current market capitalization may not be an
accurate indication of a market participant's estimate of entity-specific value measured over a reasonable period of time. As
a result, the use of market capitalization is a less relevant measure to assess the reasonableness of the aggregate value of the
reporting units. Therefore, we supplement the market capitalization information with other observable market information
that provides benchmark valuation multiples from transactions over a reasonable period.
The estimated fair value of the reporting unit is highly sensitive to changes in these estimates and assumptions; therefore, in
some instances, changes in these assumptions could impact whether the fair value of a reporting unit is greater than its carrying
value. We perform sensitivity analyses around these assumptions in order to assess the reasonableness of the assumptions and
the resulting estimated fair values. Ultimately, future potential changes in these assumptions may impact the estimated fair
value of a reporting unit and cause the fair value of the reporting unit to be below its carrying value. Additionally, a reporting
unit's carrying value of equity could change based on market conditions and the risk profile of those reporting units.