SunTrust 2013 Annual Report Download - page 176
Download and view the complete annual report
Please find page 176 of the 2013 SunTrust annual report below. You can navigate through the pages in the report by either clicking on the pages listed below, or by using the keyword search tool below to find specific information within the annual report.-
 1
1 -
2
-
3
-
4
-
5
-
6
-
7
-
8
-
9
-
10
-
11
-
12
-
13
-
14
-
15
-
16
-
17
-
18
-
19
-
20
-
21
-
22
-
23
-
24
-
25
-
26
-
27
-
28
-
29
-
30
-
31
-
32
-
33
-
34
-
35
-
36
-
37
-
38
-
39
-
40
-
41
-
42
-
43
-
44
-
45
-
46
-
47
-
48
-
49
-
50
-
51
-
52
-
53
-
54
-
55
-
56
-
57
-
58
-
59
-
60
-
61
-
62
-
63
-
64
-
65
-
66
-
67
-
68
-
69
-
70
-
71
-
72
-
73
-
74
-
75
-
76
-
77
-
78
-
79
-
80
-
81
-
82
-
83
-
84
-
85
-
86
-
87
-
88
-
89
-
90
-
91
-
92
-
93
-
94
-
95
-
96
-
97
-
98
-
99
-
100
-
101
-
102
-
103
-
104
-
105
-
106
-
107
-
108
-
109
-
110
-
111
-
112
-
113
-
114
-
115
-
116
-
117
-
118
-
119
-
120
-
121
-
122
-
123
-
124
-
125
-
126
-
127
-
128
-
129
-
130
-
131
-
132
-
133
-
134
-
135
-
136
-
137
-
138
-
139
-
140
-
141
-
142
-
143
-
144
-
145
-
146
-
147
-
148
-
149
-
150
-
151
-
152
-
153
-
154
-
155
-
156
-
157
-
158
-
159
-
160
-
161
-
162
-
163
-
164
-
165
-
 166
166 -
 167
167 -
 168
168 -
 169
169 -
 170
170 -
 171
171 -
 172
172 -
 173
173 -
 174
174 -
 175
175 -
 176
176 -
 177
177 -
 178
178 -
 179
179 -
 180
180 -
 181
181 -
 182
182 -
 183
183 -
 184
184 -
 185
185 -
 186
186 -
187
-
188
-
189
-
190
-
191
-
192
-
193
-
194
-
195
-
196
-
197
-
198
-
199
-
200
-
201
-
202
-
203
-
204
-
205
-
206
-
207
-
208
-
209
-
210
-
211
-
212
-
213
-
214
-
215
-
216
-
217
-
218
-
219
-
220
-
221
-
222
-
223
-
224
-
225
-
226
-
227
-
228
-
229
-
230
-
231
-
232
-
233
-
234
-
235
-
236
 |
 |

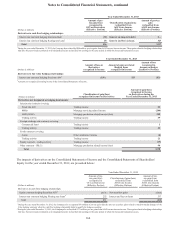
Notes to Consolidated Financial Statements, continued
160
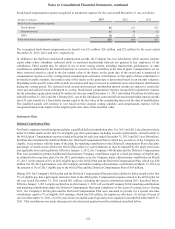
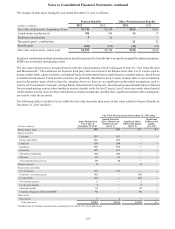
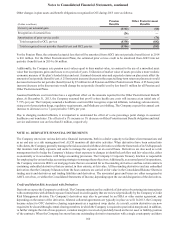
Other changes in plan assets and benefit obligations recognized in OCI during 2013 were as follows:
(Dollars in millions)
Pension
Benefits
Other Postretirement
Benefits
Current year actuarial gain ($312)($6)
Recognition of actuarial loss (26)—
Amortization of prior service credit — (76)
Total recognized in OCI, pre-tax ($338)($82)
Total recognized in net periodic (benefit)/cost and OCI, pre-tax ($386)($82)
For the Pension Plans, the estimated actuarial loss that will be amortized from AOCI into net periodic (benefit)/cost in 2014
is $16 million. For the Other Postretirement Plans, the estimated prior service credit to be amortized from AOCI into net
periodic (benefit)/cost in 2014 is $6 million.
Additionally, the Company sets pension asset values equal to their market value, in contrast to the use of a smoothed asset
value that incorporates gains and losses over a period of years. Utilization of market value of assets provides a more realistic
economic measure of the plan’s funded status and cost. Assumed discount rates and expected returns on plan assets affect the
amounts of net periodic (benefit)/cost. A 25 basis point increase/decrease in the expected long-term return on plan assets would
decrease/increase the net periodic (benefit)/cost by $7 million for all Pension and Other Postretirement Plans. A 25 basis point
increase/decrease in the discount rate would change the net periodic (benefit)/cost by less than $1 million for all Pension and
Other Postretirement Plans.
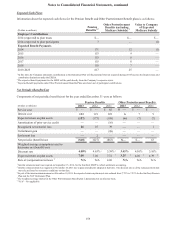
Assumed healthcare cost trend rates have a significant effect on the amounts reported for the Other Postretirement Benefit
plans. At December 31, 2013, the Company assumed that pre-65 retiree health care costs will increase at an initial rate of
7.75% per year. The Company assumed a healthcare cost trend that recognizes expected inflation, technology advancements,
rising cost of prescription drugs, regulatory requirements, and Medicare cost shifting. The Company expects this annual cost
increase to decrease over a 7-year period to 5.00% per year.
Due to changing medical inflation, it is important to understand the effect of a one percentage point change in assumed
healthcare cost trend rates. The effects of a 1% increase or 1% decrease on Other Postretirement Benefit obligation and total
service and interest cost are less than $1 million, respectively.
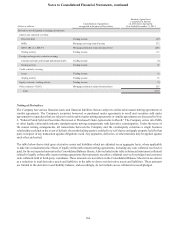
NOTE 16 - DERIVATIVE FINANCIAL INSTRUMENTS
The Company enters into various derivative financial instruments, both in a dealer capacity to facilitate client transactions and
as an end user as a risk management tool. ALCO monitors all derivative activities. When derivatives have been entered into
with clients, the Company generally manages the risk associated with these derivatives within the framework of its VAR approach
that monitors total daily exposure and seeks to manage the exposure on an overall basis. Derivatives are also used as a risk
management tool to hedge the Company’s balance sheet exposure to changes in identified cash flow and fair value risks, either
economically or in accordance with hedge accounting provisions. The Company’s Corporate Treasury function is responsible
for employing the various hedge accounting strategies to manage these objectives. Additionally, as a normal part of its operations,
the Company enters into IRLCs on mortgage loans that are accounted for as freestanding derivatives and has certain contracts
containing embedded derivatives that are carried, in their entirety, at fair value. All freestanding derivatives and any embedded
derivatives that the Company bifurcates from the host contracts are carried at fair value in the Consolidated Balance Sheets in
trading assets and derivatives and trading liabilities and derivatives. The associated gains and losses are either recognized in
AOCI, net of tax, or within the Consolidated Statements of Income, depending upon the use and designation of the derivatives.
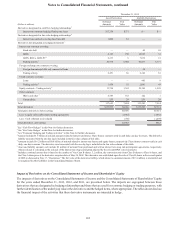
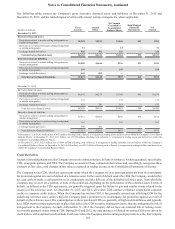
Credit and Market Risk Associated with Derivatives
Derivatives expose the Company to credit risk. The Company minimizes the credit risk of derivatives by entering into transactions
with counterparties with defined exposure limits based on credit quality that are reviewed periodically by the Company’s Credit
Risk Management division. The Company’s derivatives may also be governed by an ISDA or other master agreement, and
depending on the nature of the derivative, bilateral collateral agreements are typically in place as well. In 2013, the Company
became subject to OTC derivative clearing requirements as a registered swap dealer. As a result, certain derivatives are now
required to be cleared through central clearing members in which the Company is required to post initial margin and, in addition,
to further mitigate the risk of non-payment, variation margin is received or paid daily based on the net asset or liability position
of the contracts. When the Company has more than one outstanding derivative transaction with a single counterparty and there