SunTrust 2013 Annual Report Download - page 129
Download and view the complete annual report
Please find page 129 of the 2013 SunTrust annual report below. You can navigate through the pages in the report by either clicking on the pages listed below, or by using the keyword search tool below to find specific information within the annual report.-
 1
1 -
2
-
3
-
4
-
5
-
6
-
7
-
8
-
9
-
10
-
11
-
12
-
13
-
14
-
15
-
16
-
17
-
18
-
19
-
20
-
21
-
22
-
23
-
24
-
25
-
26
-
27
-
28
-
29
-
30
-
31
-
32
-
33
-
34
-
35
-
36
-
37
-
38
-
39
-
40
-
41
-
42
-
43
-
44
-
45
-
46
-
47
-
48
-
49
-
50
-
51
-
52
-
53
-
54
-
55
-
56
-
57
-
58
-
59
-
60
-
61
-
62
-
63
-
64
-
65
-
66
-
67
-
68
-
69
-
70
-
71
-
72
-
73
-
74
-
75
-
76
-
77
-
78
-
79
-
80
-
81
-
82
-
83
-
84
-
85
-
86
-
87
-
88
-
89
-
90
-
91
-
92
-
93
-
94
-
95
-
96
-
97
-
98
-
99
-
100
-
101
-
102
-
103
-
104
-
105
-
106
-
107
-
108
-
109
-
110
-
111
-
112
-
113
-
114
-
115
-
116
-
117
-
118
-
 119
119 -
 120
120 -
 121
121 -
 122
122 -
 123
123 -
 124
124 -
 125
125 -
 126
126 -
 127
127 -
 128
128 -
 129
129 -
 130
130 -
 131
131 -
 132
132 -
 133
133 -
 134
134 -
 135
135 -
 136
136 -
 137
137 -
 138
138 -
 139
139 -
140
-
141
-
142
-
143
-
144
-
145
-
146
-
147
-
148
-
149
-
150
-
151
-
152
-
153
-
154
-
155
-
156
-
157
-
158
-
159
-
160
-
161
-
162
-
163
-
164
-
165
-
166
-
167
-
168
-
169
-
170
-
171
-
172
-
173
-
174
-
175
-
176
-
177
-
178
-
179
-
180
-
181
-
182
-
183
-
184
-
185
-
186
-
187
-
188
-
189
-
190
-
191
-
192
-
193
-
194
-
195
-
196
-
197
-
198
-
199
-
200
-
201
-
202
-
203
-
204
-
205
-
206
-
207
-
208
-
209
-
210
-
211
-
212
-
213
-
214
-
215
-
216
-
217
-
218
-
219
-
220
-
221
-
222
-
223
-
224
-
225
-
226
-
227
-
228
-
229
-
230
-
231
-
232
-
233
-
234
-
235
-
236
 |
 |
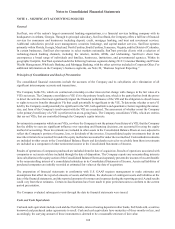
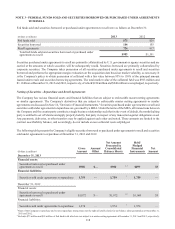
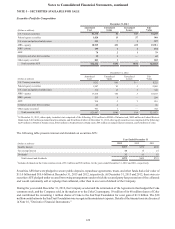
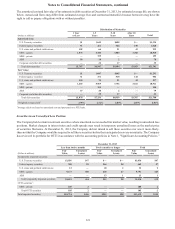
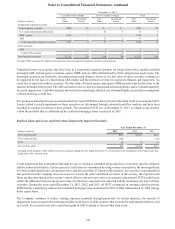
Notes to Consolidated Financial Statements, continued
113
assigned to a reporting unit exceeds the implied fair value of the goodwill, an impairment charge is recorded for the excess.
Identified intangible assets that have a designated finite life are amortized over their useful lives and are evaluated for
impairment whenever events or changes in circumstances indicate the carrying amount of the assets may not be recoverable.
For additional information on the Company’s activities related to goodwill and other intangibles, see Note 9, “Goodwill and
Other Intangible Assets.”
MSRs
The Company recognizes as assets the rights to service mortgage loans based on the estimated fair value of the MSRs when
loans are sold and the associated servicing rights are retained. The Company has elected to record all MSRs at fair value. Fair
value is determined by projecting net servicing cash flows, which are then discounted to estimate the fair value. The Company
actively hedges its MSRs. The fair values of MSRs are impacted by a variety of factors, including prepayment assumptions,
discount rates, delinquency rates, contractually specified servicing fees, servicing costs and underlying portfolio characteristics.
The underlying assumptions and estimated values are corroborated by values received from independent third parties. The
carrying value of MSRs is reported on the Consolidated Balance Sheets in other intangible assets. Servicing fees are recognized
as they are received and changes in fair value are also reported in mortgage servicing related income in the Consolidated
Statements of Income. For additional information on the Company’s servicing fees, see Note 9, “Goodwill and Other Intangible
Assets.”
Other Real Estate Owned
Assets acquired through, or in lieu of, loan foreclosure are held for sale and are initially recorded at the lower of the loan’s
cost basis or the asset’s fair value at the date of foreclosure, less estimated selling costs. To the extent fair value, less cost to
sell, is less than the loan’s cost basis, the difference is charged to the ALLL at the date of transfer into OREO. The Company
estimates market values primarily based on appraisals and other market information. Subsequent changes in value of the assets
are reported as adjustments to the asset’s carrying amount. Subsequent to foreclosure, changes in value along with gains or
losses from the disposition on these assets are reported in noninterest expense in the Consolidated Statements of Income. For
additional information on the Company's activities related to OREO, see Note 18, “Fair Value Election and Measurement.”
Loan Sales and Securitizations
The Company sells and at times may securitize loans and other financial assets. When the Company securitizes assets, it may
hold a portion of the securities issued, including senior interests, subordinated and other residual interests, interest-only strips,
and principal-only strips, all of which are considered retained interests in the transferred assets. Retained securitized interests
are recognized and initially measured at fair value. The interests in securitized assets held by the Company are typically
classified as either securities AFS or trading assets and carried at fair value, which is based on independent, third party market
prices, market prices for similar assets, or discounted cash flow analyses. If market prices are not available, fair value is
calculated using management’s best estimates of key assumptions, including credit losses, loan repayment speeds and discount
rates commensurate with the risks involved. For additional information on the Company’s securitization activities, see Note
10, “Certain Transfers of Financial Assets and Variable Interest Entities.”
Income Taxes
The provision for income taxes is based on income and expense reported for financial statement purposes after adjustment
for permanent differences such as interest income from lending to tax-exempt entities and tax credits from community
reinvestment activities. Deferred income tax assets and liabilities result from differences between the timing of the recognition
of assets and liabilities for financial reporting purposes and for income tax return purposes. These assets and liabilities are
measured using the enacted tax rates and laws that are currently in effect. Subsequent changes in the tax laws require adjustment
to these assets and liabilities with the cumulative effect included in the provision for income taxes for the period in which the
change is enacted. A valuation allowance is recognized for a DTA if, based on the weight of available evidence, it is more
likely than not that some portion or all of the DTA will not be realized. In computing the income tax provision, the Company
evaluates the technical merits of its income tax positions based on current legislative, judicial and regulatory guidance. Interest
and penalties related to the Company’s tax positions are recognized as a component of the income tax provision. For additional
information on the Company’s activities related to income taxes, see Note 14, “Income Taxes.”
Earnings Per Share
Basic EPS is computed by dividing net income available to common shareholders by the weighted average number of common
shares outstanding during each period. Diluted EPS is computed by dividing net income available to common shareholders