SunTrust 2013 Annual Report Download - page 164
Download and view the complete annual report
Please find page 164 of the 2013 SunTrust annual report below. You can navigate through the pages in the report by either clicking on the pages listed below, or by using the keyword search tool below to find specific information within the annual report.-
 1
1 -
2
-
3
-
4
-
5
-
6
-
7
-
8
-
9
-
10
-
11
-
12
-
13
-
14
-
15
-
16
-
17
-
18
-
19
-
20
-
21
-
22
-
23
-
24
-
25
-
26
-
27
-
28
-
29
-
30
-
31
-
32
-
33
-
34
-
35
-
36
-
37
-
38
-
39
-
40
-
41
-
42
-
43
-
44
-
45
-
46
-
47
-
48
-
49
-
50
-
51
-
52
-
53
-
54
-
55
-
56
-
57
-
58
-
59
-
60
-
61
-
62
-
63
-
64
-
65
-
66
-
67
-
68
-
69
-
70
-
71
-
72
-
73
-
74
-
75
-
76
-
77
-
78
-
79
-
80
-
81
-
82
-
83
-
84
-
85
-
86
-
87
-
88
-
89
-
90
-
91
-
92
-
93
-
94
-
95
-
96
-
97
-
98
-
99
-
100
-
101
-
102
-
103
-
104
-
105
-
106
-
107
-
108
-
109
-
110
-
111
-
112
-
113
-
114
-
115
-
116
-
117
-
118
-
119
-
120
-
121
-
122
-
123
-
124
-
125
-
126
-
127
-
128
-
129
-
130
-
131
-
132
-
133
-
134
-
135
-
136
-
137
-
138
-
139
-
140
-
141
-
142
-
143
-
144
-
145
-
146
-
147
-
148
-
149
-
150
-
151
-
152
-
153
-
 154
154 -
 155
155 -
 156
156 -
 157
157 -
 158
158 -
 159
159 -
 160
160 -
 161
161 -
 162
162 -
 163
163 -
 164
164 -
 165
165 -
 166
166 -
 167
167 -
 168
168 -
 169
169 -
 170
170 -
 171
171 -
 172
172 -
 173
173 -
 174
174 -
175
-
176
-
177
-
178
-
179
-
180
-
181
-
182
-
183
-
184
-
185
-
186
-
187
-
188
-
189
-
190
-
191
-
192
-
193
-
194
-
195
-
196
-
197
-
198
-
199
-
200
-
201
-
202
-
203
-
204
-
205
-
206
-
207
-
208
-
209
-
210
-
211
-
212
-
213
-
214
-
215
-
216
-
217
-
218
-
219
-
220
-
221
-
222
-
223
-
224
-
225
-
226
-
227
-
228
-
229
-
230
-
231
-
232
-
233
-
234
-
235
-
236
 |
 |

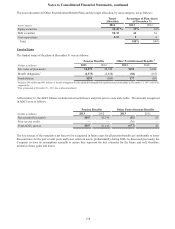
Notes to Consolidated Financial Statements, continued
148
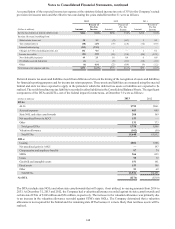
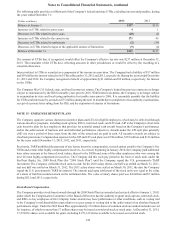
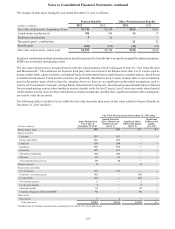
A reconciliation of the expected income tax expense at the statutory federal income tax rate of 35% to the Company’s actual
provision for income taxes and the effective tax rate during the years ended December 31 were as follows:
2013 2012 2011
(Dollars in millions) Amount
Percent of
Pre-Tax
Income Amount
Percent of
Pre-Tax
Income Amount
Percent of
Pre-Tax
Income
Income tax expense at federal statutory rate $566 35.0% $956 35.0% $254 35.0%
Increase (decrease) resulting from:
State income taxes, net 20 1.2 (9) (0.3) 1 0.1
Tax-exempt interest (80) (4.9) (77) (2.8) (72) (9.9)
Internal restructuring (343) (21.3) —— ——
Changes in UTBs (including interest), net 152 9.4 1 — 1 0.1
Income tax credits (84) (5.2) (83) (3.0) (88) (12.1)
Non-deductible expenses 49 3.1 16 0.6 6 0.8
Dividends received deduction (1) — (8) (0.3) (14) (1.9)
Other (6) (0.4) (23) (0.9) (9) (1.2)
Total income tax expense and rate $273 16.9% $773 28.3% $79 10.9%
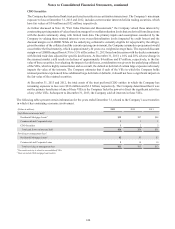
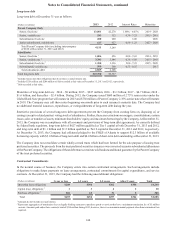
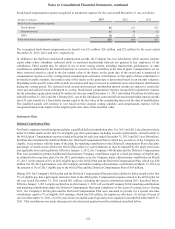
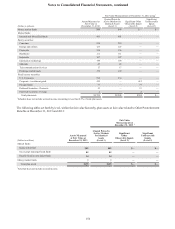
Deferred income tax assets and liabilities result from differences between the timing of the recognition of assets and liabilities
for financial reporting purposes and for income tax return purposes. These assets and liabilities are measured using the enacted
federal and state tax rates expected to apply in the periods in which the deferred tax assets or liabilities are expected to be
realized. The net deferred income tax liability is recorded in other liabilities in the Consolidated Balance Sheets. The significant
components of the DTAs and DTLs, net of the federal impact for state taxes, at December 31 were as follows:
(Dollars in millions) 2013 2012
DTAs:
ALLL $795 $861
Accrued expenses 463 685
State NOL and other carryforwards 208 169
Net unrealized losses in AOCI 153 —
Other 131 173
Total gross DTAs 1,750 1,888
Valuation allowance (102) (56)
Total DTAs $1,648 $1,832
DTLs:
Leasing $804 $786
Net unrealized gains in AOCI —197
Compensation and employee benefits 97 74
MSRs 566 623
Loans 98 72
Goodwill and intangible assets 151 141
Fixed assets 153 196
Other 53 62
Total DTLs $1,922 $2,151
Net DTL ($274) ($319)
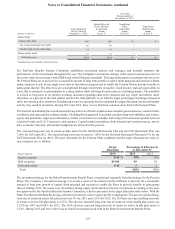
The DTAs include state NOLs and other state carryforwards that will expire, if not utilized, in varying amounts from 2014 to
2033. At December 31, 2013 and 2012, the Company had a valuation allowance recorded against its state carryforwards and
certain state DTAs of $102 million and $56 million, respectively. The increase in the valuation allowance was primarily due
to an increase in the valuation allowance recorded against STM’s state NOLs. The Company determined that a valuation
allowance is not required for the federal and the remaining state DTAs because it is more likely than not these assets will be
realized.