SunTrust 2013 Annual Report Download - page 72
Download and view the complete annual report
Please find page 72 of the 2013 SunTrust annual report below. You can navigate through the pages in the report by either clicking on the pages listed below, or by using the keyword search tool below to find specific information within the annual report.-
 1
1 -
2
-
3
-
4
-
5
-
6
-
7
-
8
-
9
-
10
-
11
-
12
-
13
-
14
-
15
-
16
-
17
-
18
-
19
-
20
-
21
-
22
-
23
-
24
-
25
-
26
-
27
-
28
-
29
-
30
-
31
-
32
-
33
-
34
-
35
-
36
-
37
-
38
-
39
-
40
-
41
-
42
-
43
-
44
-
45
-
46
-
47
-
48
-
49
-
50
-
51
-
52
-
53
-
54
-
55
-
56
-
57
-
58
-
59
-
60
-
61
-
 62
62 -
 63
63 -
 64
64 -
 65
65 -
 66
66 -
 67
67 -
 68
68 -
 69
69 -
 70
70 -
 71
71 -
 72
72 -
 73
73 -
 74
74 -
 75
75 -
 76
76 -
 77
77 -
 78
78 -
 79
79 -
 80
80 -
 81
81 -
 82
82 -
83
-
84
-
85
-
86
-
87
-
88
-
89
-
90
-
91
-
92
-
93
-
94
-
95
-
96
-
97
-
98
-
99
-
100
-
101
-
102
-
103
-
104
-
105
-
106
-
107
-
108
-
109
-
110
-
111
-
112
-
113
-
114
-
115
-
116
-
117
-
118
-
119
-
120
-
121
-
122
-
123
-
124
-
125
-
126
-
127
-
128
-
129
-
130
-
131
-
132
-
133
-
134
-
135
-
136
-
137
-
138
-
139
-
140
-
141
-
142
-
143
-
144
-
145
-
146
-
147
-
148
-
149
-
150
-
151
-
152
-
153
-
154
-
155
-
156
-
157
-
158
-
159
-
160
-
161
-
162
-
163
-
164
-
165
-
166
-
167
-
168
-
169
-
170
-
171
-
172
-
173
-
174
-
175
-
176
-
177
-
178
-
179
-
180
-
181
-
182
-
183
-
184
-
185
-
186
-
187
-
188
-
189
-
190
-
191
-
192
-
193
-
194
-
195
-
196
-
197
-
198
-
199
-
200
-
201
-
202
-
203
-
204
-
205
-
206
-
207
-
208
-
209
-
210
-
211
-
212
-
213
-
214
-
215
-
216
-
217
-
218
-
219
-
220
-
221
-
222
-
223
-
224
-
225
-
226
-
227
-
228
-
229
-
230
-
231
-
232
-
233
-
234
-
235
-
236
 |
 |

56
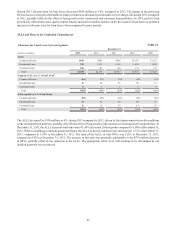
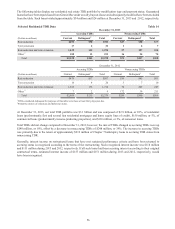
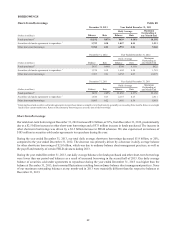
The following tables display our residential real estate TDR portfolio by modification type and payment status. Guaranteed
loans that have been repurchased from Ginnie Mae under an early buyout clause and subsequently modified have been excluded
from the table. Such loans totaled approximately $54 million and $24 million at December 31, 2013 and 2012, respectively.
Selected Residential TDR Data Table 14
December 31, 2013
Accruing TDRs Nonaccruing TDRs
(Dollars in millions) Current Delinquent1Total Current Delinquent1Total
Rate reduction $692 $90 $782 $27 $50 $77
Term extension 17 4 21 1 6 7
Rate reduction and term extension 1,439 135 1,574 27 127 154
Other 2180 13 193 16 54 70
Total $2,328 $242 $2,570 $71 $237 $308
December 31, 2012
Accruing TDRs Nonaccruing TDRs
(Dollars in millions) Current Delinquent1Total Current Delinquent1Total
Rate reduction $470 $37 $507 $36 $45 $81
Term extension 16 4 20 3 7 10
Rate reduction and term extension 1,562 172 1,734 78 209 287
Other 27 2 9 172 39 211
Total $2,055 $215 $2,270 $289 $300 $589
1 TDRs considered delinquent for purposes of this table were those at least thirty days past due.
2 Primarily consists of extensions and deficiency notes.
At December 31, 2013, our total TDR portfolio was $3.1 billion and was composed of $2.9 billion, or 92%, of residential
loans (predominantly first and second lien residential mortgages and home equity lines of credit), $150 million, or 5%, of
commercial loans (predominantly income-producing properties), and $110 million, or 3%, of consumer loans.
Total TDRs did not change compared to December 31, 2012; however, the mix of TDRs changed as accruing TDRs were up
$248 million, or 10%, offset by a decrease in nonaccruing TDRs of $248 million, or 39%. The increase in accruing TDRs
was primarily due to the return of approximately $219 million of Chapter 7 bankruptcy loans to accruing TDR status from
nonaccruing TDR.
Generally, interest income on restructured loans that have met sustained performance criteria and have been returned to
accruing status is recognized according to the terms of the restructuring. Such recognized interest income was $118 million
and $111 million during 2013 and 2012, respectively. If all such loans had been accruing interest according to their original
contractual terms, estimated interest income of $157 million and $151 million during 2013 and 2012, respectively, would
have been recognized.