SunTrust 2013 Annual Report Download - page 80
Download and view the complete annual report
Please find page 80 of the 2013 SunTrust annual report below. You can navigate through the pages in the report by either clicking on the pages listed below, or by using the keyword search tool below to find specific information within the annual report.-
 1
1 -
2
-
3
-
4
-
5
-
6
-
7
-
8
-
9
-
10
-
11
-
12
-
13
-
14
-
15
-
16
-
17
-
18
-
19
-
20
-
21
-
22
-
23
-
24
-
25
-
26
-
27
-
28
-
29
-
30
-
31
-
32
-
33
-
34
-
35
-
36
-
37
-
38
-
39
-
40
-
41
-
42
-
43
-
44
-
45
-
46
-
47
-
48
-
49
-
50
-
51
-
52
-
53
-
54
-
55
-
56
-
57
-
58
-
59
-
60
-
61
-
62
-
63
-
64
-
65
-
66
-
67
-
68
-
69
-
 70
70 -
 71
71 -
 72
72 -
 73
73 -
 74
74 -
 75
75 -
 76
76 -
 77
77 -
 78
78 -
 79
79 -
 80
80 -
 81
81 -
 82
82 -
 83
83 -
 84
84 -
 85
85 -
 86
86 -
 87
87 -
 88
88 -
 89
89 -
 90
90 -
91
-
92
-
93
-
94
-
95
-
96
-
97
-
98
-
99
-
100
-
101
-
102
-
103
-
104
-
105
-
106
-
107
-
108
-
109
-
110
-
111
-
112
-
113
-
114
-
115
-
116
-
117
-
118
-
119
-
120
-
121
-
122
-
123
-
124
-
125
-
126
-
127
-
128
-
129
-
130
-
131
-
132
-
133
-
134
-
135
-
136
-
137
-
138
-
139
-
140
-
141
-
142
-
143
-
144
-
145
-
146
-
147
-
148
-
149
-
150
-
151
-
152
-
153
-
154
-
155
-
156
-
157
-
158
-
159
-
160
-
161
-
162
-
163
-
164
-
165
-
166
-
167
-
168
-
169
-
170
-
171
-
172
-
173
-
174
-
175
-
176
-
177
-
178
-
179
-
180
-
181
-
182
-
183
-
184
-
185
-
186
-
187
-
188
-
189
-
190
-
191
-
192
-
193
-
194
-
195
-
196
-
197
-
198
-
199
-
200
-
201
-
202
-
203
-
204
-
205
-
206
-
207
-
208
-
209
-
210
-
211
-
212
-
213
-
214
-
215
-
216
-
217
-
218
-
219
-
220
-
221
-
222
-
223
-
224
-
225
-
226
-
227
-
228
-
229
-
230
-
231
-
232
-
233
-
234
-
235
-
236
 |
 |
64
The concept of Tier 1 common equity, the portion of Tier 1 capital that is considered common equity, was first introduced in
the 2009 SCAP. Our primary regulator, rather than U.S. GAAP, defines Tier 1 common equity and the Tier 1 common equity
ratio. As a result, our calculation of these measures may differ from those of other financial services companies who calculate
them. However, Tier 1 common equity and the Tier 1 common equity ratio continue to be important factors which regulators
examine in evaluating financial institutions; therefore, we present these measures to allow for evaluations of our capital.
Further, on October 11, 2013, the Federal Reserve published final rules in the Federal Register related to required minimum
capital ratios that become effective for us on January 1, 2015. See further discussion below under "Basel III."
On January 1, 2013, the new Risk-Based Capital Guidelines: Market Risk Rule (the "Market Risk Rule") promulgated by the
Federal Reserve and other U.S. regulators became effective. The application of the Market Risk Rule required changes to the
computation of RWA associated with assets held in our trading account and expanded the calculation to include a stressed
VAR measure among other things. See the "Market Risk from Trading Activities" section of this MD&A for additional
discussion.
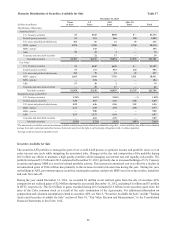
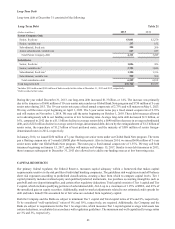
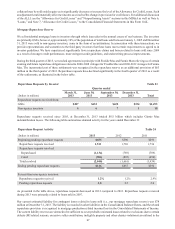
Regulatory Capital Ratios Table 22
December 31
(Dollars in millions) 2013 2012 2011
Tier 1 capital $16,073 $14,975 $14,490
Total capital 19,052 18,131 18,177
RWA 148,746 134,524 132,940
Average total assets for leverage ratio 167,848 168,053 165,573
Tier 1 common equity:
Tier 1 capital $16,073 $14,975 $14,490
Less:
Qualifying trust preferred securities 627 627 1,854
Preferred stock 725 725 275
Allowable minority interest 119 114 107
Tier 1 common equity $14,602 $13,509 $12,254
Risk-based ratios:
Tier 1 common equity19.82% 10.04% 9.22%
Tier 1 capital 10.81 11.13 10.90
Total capital 12.81 13.48 13.67
Tier 1 leverage ratio 9.58 8.91 8.75
Total shareholders’ equity to assets 12.22 12.10 11.35
1 At December 31, 2013, our Basel III Common Equity Tier 1 ratio as calculated under the final Basel III capital rules was estimated to
be 9.6%. See the "Reconcilement of Non-U.S. GAAP Measures - Annual" section in this MD&A for a reconciliation of the current
Basel I ratio to the estimated Basel III ratio.
At December 31, 2013, our capital ratios were well above current regulatory requirements. The small decline in our capital
ratios compared to December 31, 2012, was primarily due to an increase in our RWA primarily as a result of loan growth
during 2013, the aforementioned change related to the Market Risk Rule, as well as an increase in off-balance sheet unused
lending commitments. These increases in RWAs offset the positive impact on our ratios related to an increase in our regulatory
capital during 2013, which was driven by an increase in retained earnings.
We declared and paid common dividends totaling $188 million, or $0.35 per common share during 2013, compared with $107
million, or $0.20 per common share during 2012. Additionally, we declared and paid dividends in 2013 and 2012 of $37
million and $12 million, respectively, on our preferred stock.
Substantially all of our retained earnings are undistributed earnings of the Bank, which are restricted by various regulations
administered by federal and state bank regulatory authorities. At December 31, 2013 and 2012, retained earnings of the Bank
available for payment of cash dividends to the Parent Company under these regulations totaled approximately $2.6 billion
and $1.8 billion, respectively.
During 2013, we submitted our capital plan for review by the Federal Reserve in conjunction with the 2013 CCAR process.
Upon completion of the Federal Reserve's review, they did not object to our planned capital actions. As such, during 2013
we maintained dividend payments on our preferred stock, increased our quarterly common stock dividend from $0.05 to $0.10
beginning in the second quarter, and repurchased a total of $150 million, or approximately 4.6 million shares, of our outstanding
common stock. Also pursuant to our capital plan, we repurchased an additional $50 million of our outstanding common stock