SunTrust 2013 Annual Report Download - page 142
Download and view the complete annual report
Please find page 142 of the 2013 SunTrust annual report below. You can navigate through the pages in the report by either clicking on the pages listed below, or by using the keyword search tool below to find specific information within the annual report.-
 1
1 -
2
-
3
-
4
-
5
-
6
-
7
-
8
-
9
-
10
-
11
-
12
-
13
-
14
-
15
-
16
-
17
-
18
-
19
-
20
-
21
-
22
-
23
-
24
-
25
-
26
-
27
-
28
-
29
-
30
-
31
-
32
-
33
-
34
-
35
-
36
-
37
-
38
-
39
-
40
-
41
-
42
-
43
-
44
-
45
-
46
-
47
-
48
-
49
-
50
-
51
-
52
-
53
-
54
-
55
-
56
-
57
-
58
-
59
-
60
-
61
-
62
-
63
-
64
-
65
-
66
-
67
-
68
-
69
-
70
-
71
-
72
-
73
-
74
-
75
-
76
-
77
-
78
-
79
-
80
-
81
-
82
-
83
-
84
-
85
-
86
-
87
-
88
-
89
-
90
-
91
-
92
-
93
-
94
-
95
-
96
-
97
-
98
-
99
-
100
-
101
-
102
-
103
-
104
-
105
-
106
-
107
-
108
-
109
-
110
-
111
-
112
-
113
-
114
-
115
-
116
-
117
-
118
-
119
-
120
-
121
-
122
-
123
-
124
-
125
-
126
-
127
-
128
-
129
-
130
-
131
-
 132
132 -
 133
133 -
 134
134 -
 135
135 -
 136
136 -
 137
137 -
 138
138 -
 139
139 -
 140
140 -
 141
141 -
 142
142 -
 143
143 -
 144
144 -
 145
145 -
 146
146 -
 147
147 -
 148
148 -
 149
149 -
 150
150 -
 151
151 -
 152
152 -
153
-
154
-
155
-
156
-
157
-
158
-
159
-
160
-
161
-
162
-
163
-
164
-
165
-
166
-
167
-
168
-
169
-
170
-
171
-
172
-
173
-
174
-
175
-
176
-
177
-
178
-
179
-
180
-
181
-
182
-
183
-
184
-
185
-
186
-
187
-
188
-
189
-
190
-
191
-
192
-
193
-
194
-
195
-
196
-
197
-
198
-
199
-
200
-
201
-
202
-
203
-
204
-
205
-
206
-
207
-
208
-
209
-
210
-
211
-
212
-
213
-
214
-
215
-
216
-
217
-
218
-
219
-
220
-
221
-
222
-
223
-
224
-
225
-
226
-
227
-
228
-
229
-
230
-
231
-
232
-
233
-
234
-
235
-
236
 |
 |
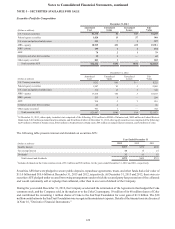
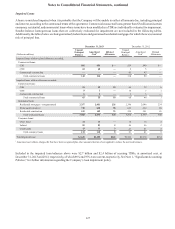
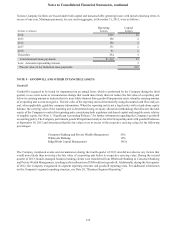
Notes to Consolidated Financial Statements, continued
126
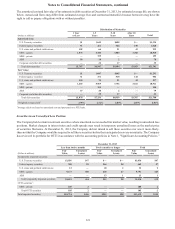
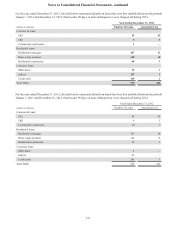
The payment status for the LHFI portfolio is shown in the tables below:
December 31, 2013
(Dollars in millions)
Accruing
Current
Accruing
30-89 Days
Past Due
Accruing
90+ Days
Past Due Nonaccruing 2Total
Commercial loans:
C&I $57,713 $47 $18 $196 $57,974
CRE 5,430 5 7 39 5,481
Commercial construction 842 1 — 12 855
Total commercial loans 63,985 53 25 247 64,310
Residential loans:
Residential mortgages - guaranteed 2,787 58 571 — 3,416
Residential mortgages - nonguaranteed123,808 150 13 441 24,412
Home equity products 14,480 119 — 210 14,809
Residential construction 488 4 — 61 553
Total residential loans 41,563 331 584 712 43,190
Consumer loans:
Guaranteed student loans 4,475 461 609 — 5,545
Other direct 2,803 18 3 5 2,829
Indirect 11,189 75 1 7 11,272
Credit cards 718 7 6 — 731
Total consumer loans 19,185 561 619 12 20,377
Total LHFI $124,733 $945 $1,228 $971 $127,877
1 Includes $302 million of loans carried at fair value, the majority of which were accruing current.
2 Nonaccruing loans past due 90 days or more totaled $653 million. Nonaccruing loans past due fewer than 90 days include modified nonaccrual loans reported
as TDRs and performing second lien loans which are classified as nonaccrual when the first lien loan is nonperforming.
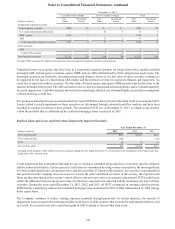
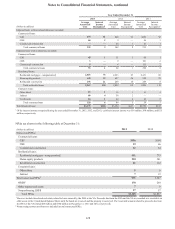
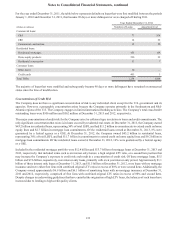
December 31, 2012
(Dollars in millions)
Accruing
Current
Accruing
30-89 Days
Past Due
Accruing
90+ Days
Past Due Nonaccruing 2Total
Commercial loans:
C&I $53,747 $81 $26 $194 $54,048
CRE 4,050 11 — 66 4,127
Commercial construction 679 — — 34 713
Total commercial loans 58,476 92 26 294 58,888
Residential loans:
Residential mortgages - guaranteed 3,523 39 690 — 4,252
Residential mortgages - nonguaranteed122,401 192 21 775 23,389
Home equity products 14,314 149 1 341 14,805
Residential construction 625 15 1 112 753
Total residential loans 40,863 395 713 1,228 43,199
Consumer loans:
Guaranteed student loans 4,769 556 32 — 5,357
Other direct 2,372 15 3 6 2,396
Indirect 10,909 68 2 19 10,998
Credit cards 619 7 6 — 632
Total consumer loans 18,669 646 43 25 19,383
Total LHFI $118,008 $1,133 $782 $1,547 $121,470
1 Includes $379 million of loans carried at fair value, the majority of which were accruing current.
2 Nonaccruing loans past due 90 days or more totaled $975 million. Nonaccruing loans past due fewer than 90 days include modified nonaccrual loans reported
as TDRs and performing second lien loans which are classified as nonaccrual when the first lien loan is nonperforming.