SunTrust 2013 Annual Report Download - page 103
Download and view the complete annual report
Please find page 103 of the 2013 SunTrust annual report below. You can navigate through the pages in the report by either clicking on the pages listed below, or by using the keyword search tool below to find specific information within the annual report.-
 1
1 -
2
-
3
-
4
-
5
-
6
-
7
-
8
-
9
-
10
-
11
-
12
-
13
-
14
-
15
-
16
-
17
-
18
-
19
-
20
-
21
-
22
-
23
-
24
-
25
-
26
-
27
-
28
-
29
-
30
-
31
-
32
-
33
-
34
-
35
-
36
-
37
-
38
-
39
-
40
-
41
-
42
-
43
-
44
-
45
-
46
-
47
-
48
-
49
-
50
-
51
-
52
-
53
-
54
-
55
-
56
-
57
-
58
-
59
-
60
-
61
-
62
-
63
-
64
-
65
-
66
-
67
-
68
-
69
-
70
-
71
-
72
-
73
-
74
-
75
-
76
-
77
-
78
-
79
-
80
-
81
-
82
-
83
-
84
-
85
-
86
-
87
-
88
-
89
-
90
-
91
-
92
-
 93
93 -
 94
94 -
 95
95 -
 96
96 -
 97
97 -
 98
98 -
 99
99 -
 100
100 -
 101
101 -
 102
102 -
 103
103 -
 104
104 -
 105
105 -
 106
106 -
 107
107 -
 108
108 -
 109
109 -
 110
110 -
 111
111 -
 112
112 -
 113
113 -
114
-
115
-
116
-
117
-
118
-
119
-
120
-
121
-
122
-
123
-
124
-
125
-
126
-
127
-
128
-
129
-
130
-
131
-
132
-
133
-
134
-
135
-
136
-
137
-
138
-
139
-
140
-
141
-
142
-
143
-
144
-
145
-
146
-
147
-
148
-
149
-
150
-
151
-
152
-
153
-
154
-
155
-
156
-
157
-
158
-
159
-
160
-
161
-
162
-
163
-
164
-
165
-
166
-
167
-
168
-
169
-
170
-
171
-
172
-
173
-
174
-
175
-
176
-
177
-
178
-
179
-
180
-
181
-
182
-
183
-
184
-
185
-
186
-
187
-
188
-
189
-
190
-
191
-
192
-
193
-
194
-
195
-
196
-
197
-
198
-
199
-
200
-
201
-
202
-
203
-
204
-
205
-
206
-
207
-
208
-
209
-
210
-
211
-
212
-
213
-
214
-
215
-
216
-
217
-
218
-
219
-
220
-
221
-
222
-
223
-
224
-
225
-
226
-
227
-
228
-
229
-
230
-
231
-
232
-
233
-
234
-
235
-
236
 |
 |

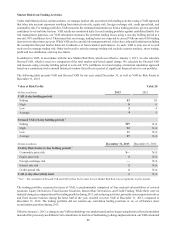
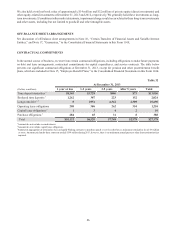
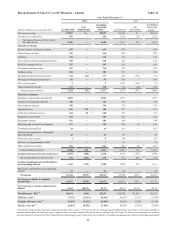
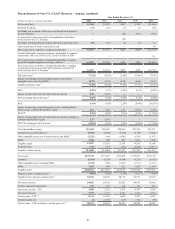
87
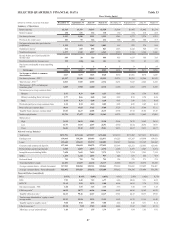
SELECTED QUARTERLY FINANCIAL DATA Table 33
Three Months Ended
2013 2012
(Dollars in millions, except per share data) December 31 September 30 June 30 March 31 December 31 September 30 June 30 March 31
Summary of Operations:
Interest income $1,343 $1,339 $1,347 $1,359 $1,396 $1,445 $1,492 $1,534
Interest expense 130 131 136 138 150 174 218 223
Net interest income 1,213 1,208 1,211 1,221 1,246 1,271 1,274 1,311
Provision for credit losses 101 95 146 212 328 450 300 317
Net interest income after provision for
credit losses 1,112 1,113 1,065 1,009 918 821 974 994
Noninterest income1814 680 858 863 1,015 2,542 940 876
Noninterest expense 1,377 1,743 1,397 1,363 1,510 1,726 1,546 1,541
Income before provision/(benefit) for
income taxes 549 50 526 509 423 1,637 368 329
Provision/(benefit) for income taxes 122 (146) 146 151 62 551 91 69
Net income attributable to noncontrolling
interest 1 736 59210
Net income $426 $189 $377 $352 $356 $1,077 $275 $250
Net income available to common
shareholders $413 $179 $365 $340 $350 $1,066 $270 $245
Net interest income - FTE 2$1,247 $1,240 $1,242 $1,251 $1,276 $1,301 $1,306 $1,342
Total revenue - FTE 1,2 2,061 1,920 2,100 2,114 2,291 3,843 2,246 2,218
Total revenue - FTE, excluding net
securities gains 2 2,060 1,920 2,100 2,112 2,290 1,902 2,232 2,200
Net income per average common share:
Diluted 0.77 0.33 0.68 0.63 0.65 1.98 0.50 0.46
Diluted, excluding Form 8-K items 20.77 0.66 0.68 0.63 0.65 0.58 0.50 0.46
Basic 0.78 0.33 0.68 0.64 0.66 1.99 0.51 0.46
Dividends paid per average common share 0.10 0.10 0.10 0.05 0.05 0.05 0.05 0.05
Book value per common share 38.61 37.85 37.65 37.89 37.59 37.35 37.69 37.11
Tangible book value per common share 227.01 26.27 26.08 26.33 25.98 25.72 26.02 25.49
Market capitalization 19,734 17,427 17,005 15,563 15,279 15,232 13,045 13,005
Market price:
High 36.99 36.29 32.84 29.98 30.64 30.79 24.83 24.93
Low 31.97 31.59 26.97 26.93 25.30 22.34 20.96 18.07
Close 36.81 32.42 31.57 28.81 28.35 28.27 24.23 24.17
Selected Average Balances
Total assets $173,791 $171,838 $172,537 $171,808 $174,510 $175,282 $177,915 $176,855
Earning assets 154,664 154,250 153,495 152,471 151,225 153,207 154,890 154,623
Loans 125,649 122,672 121,372 120,882 121,587 124,080 123,365 122,542
Consumer and commercial deposits 127,460 126,618 126,579 127,655 127,907 125,353 125,885 125,843
Brokered time and foreign deposits 2,010 2,007 2,075 2,170 2,266 2,237 2,243 2,274
Intangible assets including MSRs 7,658 7,643 7,455 7,379 7,278 7,274 7,383 7,354
MSRs 1,253 1,232 1,039 957 848 829 955 919
Preferred Stock 725 725 725 725 334 275 275 275
Total shareholders’ equity 21,251 21,027 21,272 21,117 20,630 20,619 20,472 20,256
Average common shares - diluted (thousands) 537,921 538,850 539,763 539,862 539,618 538,699 537,495 536,407
Average common shares - basic (thousands) 532,492 533,829 535,172 535,680 535,012 534,506 533,964 533,100
Financial Ratios (Annualized)
ROA 0.97% 0.44% 0.88% 0.83% 0.81% 2.45% 0.62% 0.57%
ROE 7.99 3.49 7.12 6.77 6.86 20.84 5.31 4.89
ROTCE 211.61 5.10 10.35 9.88 10.04 30.51 7.79 7.21
Net interest margin - FTE 3.20 3.19 3.25 3.33 3.36 3.38 3.39 3.49
Efficiency ratio 366.82 90.77 66.56 64.46 65.93 44.90 68.83 69.50
Tangible efficiency ratio 266.61 90.46 66.27 64.17 65.63 44.47 68.33 69.02
Total average shareholders’ equity to total
average assets 12.23 12.24 12.33 12.29 11.82 11.76 11.51 11.45
Tangible equity to tangible assets 29.00 8.98 8.95 9.00 8.82 8.48 8.31 8.14
Effective tax rate 422.30 NM 27.89 30.04 14.86 33.82 24.85 21.55
Allowance to year-end total loans 1.60 1.67 1.75 1.79 1.80 1.84 1.85 1.92