SunTrust 2013 Annual Report Download - page 52
Download and view the complete annual report
Please find page 52 of the 2013 SunTrust annual report below. You can navigate through the pages in the report by either clicking on the pages listed below, or by using the keyword search tool below to find specific information within the annual report.-
 1
1 -
2
-
3
-
4
-
5
-
6
-
7
-
8
-
9
-
10
-
11
-
12
-
13
-
14
-
15
-
16
-
17
-
18
-
19
-
20
-
21
-
22
-
23
-
24
-
25
-
26
-
27
-
28
-
29
-
30
-
31
-
32
-
33
-
34
-
35
-
36
-
37
-
38
-
39
-
40
-
41
-
 42
42 -
 43
43 -
 44
44 -
 45
45 -
 46
46 -
 47
47 -
 48
48 -
 49
49 -
 50
50 -
 51
51 -
 52
52 -
 53
53 -
 54
54 -
 55
55 -
 56
56 -
 57
57 -
 58
58 -
 59
59 -
 60
60 -
 61
61 -
 62
62 -
63
-
64
-
65
-
66
-
67
-
68
-
69
-
70
-
71
-
72
-
73
-
74
-
75
-
76
-
77
-
78
-
79
-
80
-
81
-
82
-
83
-
84
-
85
-
86
-
87
-
88
-
89
-
90
-
91
-
92
-
93
-
94
-
95
-
96
-
97
-
98
-
99
-
100
-
101
-
102
-
103
-
104
-
105
-
106
-
107
-
108
-
109
-
110
-
111
-
112
-
113
-
114
-
115
-
116
-
117
-
118
-
119
-
120
-
121
-
122
-
123
-
124
-
125
-
126
-
127
-
128
-
129
-
130
-
131
-
132
-
133
-
134
-
135
-
136
-
137
-
138
-
139
-
140
-
141
-
142
-
143
-
144
-
145
-
146
-
147
-
148
-
149
-
150
-
151
-
152
-
153
-
154
-
155
-
156
-
157
-
158
-
159
-
160
-
161
-
162
-
163
-
164
-
165
-
166
-
167
-
168
-
169
-
170
-
171
-
172
-
173
-
174
-
175
-
176
-
177
-
178
-
179
-
180
-
181
-
182
-
183
-
184
-
185
-
186
-
187
-
188
-
189
-
190
-
191
-
192
-
193
-
194
-
195
-
196
-
197
-
198
-
199
-
200
-
201
-
202
-
203
-
204
-
205
-
206
-
207
-
208
-
209
-
210
-
211
-
212
-
213
-
214
-
215
-
216
-
217
-
218
-
219
-
220
-
221
-
222
-
223
-
224
-
225
-
226
-
227
-
228
-
229
-
230
-
231
-
232
-
233
-
234
-
235
-
236
 |
 |

36
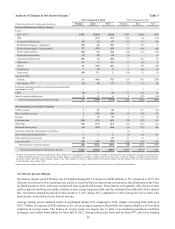
losses and noninterest expenses was a decrease in total revenue in 2013 compared to 2012, driven by declines in both net interest
income and noninterest income. Net interest income decreased 5% during 2013 compared to 2012, primarily due to the continued
low interest rate environment. Noninterest income decreased 40% during 2013 compared to 2012; however, excluding the Form
8-K items, it decreased 16% primarily due to lower mortgage-related income, partially offset by higher wealth management and
capital markets revenue in 2013. See Table 36, "Reconcilement of Non-U.S. GAAP Measures - Annual," for a reconciliation of
Form 8-K items from 2013 and 2012.
Our efficiency and tangible efficiency ratios during 2013 were 71.8% and 71.5%, respectively, compared to 59.7% and 59.2%,
respectively, in 2012; however, both years were impacted by the Form 8-K items previously mentioned. Excluding the impact of
Form 8-K items in 2013 and 2012, our tangible efficiency ratio was 65.9% during 2013 and improved 148 basis points compared
to 2012. Excluding Form 8-K items from 2012, our tangible efficiency ratio improved 465 basis points compared to 2011. Our
long-term goal is to be a more efficient organization with a tangible efficiency ratio under 60%, and we expect to make further
progress on achieving our long-term goal with a target to be under 64% by the end of 2014.
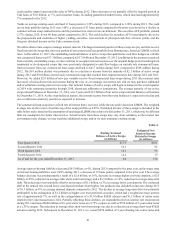
Our asset quality metrics were a key driver to improved performance during 2013, as NPLs, NPAs, and net charge-offs all declined
to seven year lows. Total NPLs declined 37% from the December 31, 2012 level, driven by reduced inflows into nonaccrual,
continuing resolution of problem loans, and return to accruing status of loans previously discharged in Chapter 7 bankruptcy that
exhibited a period of sustained payment performance since being discharged. Declines in NPLs were experienced in all loan
portfolios, with the largest decline coming from the residential portfolio driven by the Chapter 7 bankruptcy loans returning to
accruing status, in addition to lower foreclosures, lower net charge-offs, and improved loan performance. OREO declined 36%
during 2013 compared to 2012, to $170 million at December 31, 2013, which is the lowest level since 2006. The decline from
2012 was primarily driven by decreased inflows and sales of existing properties. Our restructured loan portfolio was stable compared
to December 31, 2012, while the mix changed. Accruing restructured loans increased 10% compared to December 31, 2012,
primarily as a result of Chapter 7 bankruptcy loans returning to accruing status during 2013. Additionally, nonaccruing restructured
loans decreased 39% and were only 12% of the total restructured portfolio at December 31, 2013. The accruing restructured
portfolio continued to exhibit strong payment performance, with 96% of the portfolio current on principal and interest payments
at December 31, 2013. Early stage delinquencies, a leading indicator of asset quality, particularly for consumer loans, declined
during 2013, both in total and when excluding government-guaranteed loan delinquencies.
At December 31, 2013, the ALLL was 1.60% of total loans, a decline of 20 basis points compared to December 31, 2012. The
provision for loan losses decreased 61% and net charge-offs decreased 60% during 2013 compared to 2012. The declines were
the result of improved credit quality, as well as the incremental charge-offs and provision recorded in 2012 related to NPL sales,
the junior lien credit policy change, and the Chapter 7 bankruptcy loan reclassification to nonaccruing. Net charge-offs to total
average loans was 0.55% during 2013 compared to 1.37% during 2012, a decline of 82 basis points driven by decreases in charge-
offs within each segment, including the incremental charge-offs related to NPL sales, junior lien policy change, and Chapter 7
bankruptcy loans during 2012. Improvements in asset quality have been driven by the stronger housing market, lower residential
delinquencies, lower loss severities, and higher prices upon disposition of foreclosed assets. In 2014, we expect further, but
moderating, improvements in asset quality primarily driven by residential loans. However, as asset quality metrics approach more
normalized levels, we expect the positive impacts on net income resulting from declines in net charge-offs and the ALLL to abate.
As we experienced in the fourth quarter of 2013, positive loan growth may offset the effects of future asset quality improvements
and may result in loan loss provision growth. See additional discussion of credit and asset quality in the “Loans,” “Allowance for
Credit Losses,” and “Nonperforming Assets,” sections of this MD&A.
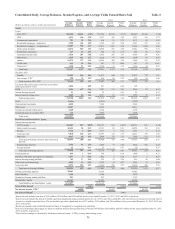
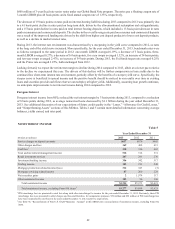
Average loans were stable during 2013 compared to 2012; however, the mix of loans changed considerably with an increase in
C&I and consumer loans, excluding student loans, while the guaranteed residential mortgage and student loan portfolio declined
significantly, primarily as a result of sales in the latter half of 2012. Also declining significantly in 2013 compared to 2012 was
average NPLs, down over $1.1 billion, primarily due to our continued resolution efforts and NPL sales in 2012. While average
loans were stable compared to 2012, an increase in loan originations in late 2013 resulted in total loans increasing 5% at
December 31, 2013, compared to December 31, 2012. The increase was due to growth in the consumer portfolio and targeted
growth of our C&I and CRE portfolios. We remain focused on extending credit to qualified borrowers as part of our commitment
to provide financing and fulfilling the credit needs in the communities that we serve. To that end, during 2013, we extended
approximately $97 billion in new loan originations, commitments, and renewals of commercial, residential, and consumer loans
to our clients, an increase of 8% from 2012.
Average consumer and commercial deposits increased 1% during 2013 compared to 2012. The increase during 2013 was primarily
the result of the continued increase in lower cost deposits, partially offset by a decrease in higher cost time deposits. Specifically,
average lower-cost account balances increased $3.4 billion, or 3%, and was spread across all lower-cost categories, while average
time deposits declined $2.6 billion, or 16%, during 2013 compared to 2012. Comparatively, at December 31, 2013, consumer and
commercial deposits were 2% lower compared to December 31, 2012, but lower cost balances were relatively stable while higher
cost balances drove the decline from the prior year, declining 13%. The mix shift compared to the prior year in consumer and