SunTrust 2013 Annual Report Download - page 208
Download and view the complete annual report
Please find page 208 of the 2013 SunTrust annual report below. You can navigate through the pages in the report by either clicking on the pages listed below, or by using the keyword search tool below to find specific information within the annual report.-
 1
1 -
2
-
3
-
4
-
5
-
6
-
7
-
8
-
9
-
10
-
11
-
12
-
13
-
14
-
15
-
16
-
17
-
18
-
19
-
20
-
21
-
22
-
23
-
24
-
25
-
26
-
27
-
28
-
29
-
30
-
31
-
32
-
33
-
34
-
35
-
36
-
37
-
38
-
39
-
40
-
41
-
42
-
43
-
44
-
45
-
46
-
47
-
48
-
49
-
50
-
51
-
52
-
53
-
54
-
55
-
56
-
57
-
58
-
59
-
60
-
61
-
62
-
63
-
64
-
65
-
66
-
67
-
68
-
69
-
70
-
71
-
72
-
73
-
74
-
75
-
76
-
77
-
78
-
79
-
80
-
81
-
82
-
83
-
84
-
85
-
86
-
87
-
88
-
89
-
90
-
91
-
92
-
93
-
94
-
95
-
96
-
97
-
98
-
99
-
100
-
101
-
102
-
103
-
104
-
105
-
106
-
107
-
108
-
109
-
110
-
111
-
112
-
113
-
114
-
115
-
116
-
117
-
118
-
119
-
120
-
121
-
122
-
123
-
124
-
125
-
126
-
127
-
128
-
129
-
130
-
131
-
132
-
133
-
134
-
135
-
136
-
137
-
138
-
139
-
140
-
141
-
142
-
143
-
144
-
145
-
146
-
147
-
148
-
149
-
150
-
151
-
152
-
153
-
154
-
155
-
156
-
157
-
158
-
159
-
160
-
161
-
162
-
163
-
164
-
165
-
166
-
167
-
168
-
169
-
170
-
171
-
172
-
173
-
174
-
175
-
176
-
177
-
178
-
179
-
180
-
181
-
182
-
183
-
184
-
185
-
186
-
187
-
188
-
189
-
190
-
191
-
192
-
193
-
194
-
195
-
196
-
197
-
 198
198 -
 199
199 -
 200
200 -
 201
201 -
 202
202 -
 203
203 -
 204
204 -
 205
205 -
 206
206 -
 207
207 -
 208
208 -
 209
209 -
 210
210 -
 211
211 -
 212
212 -
 213
213 -
 214
214 -
 215
215 -
 216
216 -
 217
217 -
 218
218 -
219
-
220
-
221
-
222
-
223
-
224
-
225
-
226
-
227
-
228
-
229
-
230
-
231
-
232
-
233
-
234
-
235
-
236
 |
 |
Notes to Consolidated Financial Statements, continued
192
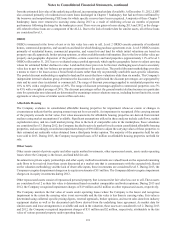
Land held for sale is measured at the lesser of carrying value or fair value less cost to sell. The fair value of the land is
determined using broker opinions, and based on the lack of observable inputs, the land is considered level 3. No impairment
charges were recognized on the land during 2013. During 2012, the Company recognized a $7 million impairment charge on
the land.
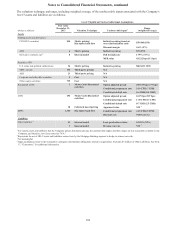
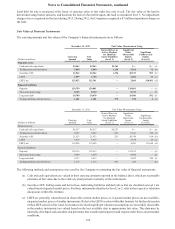
Fair Value of Financial Instruments
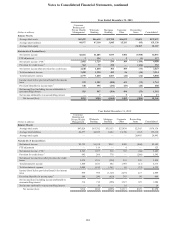
The carrying amounts and fair values of the Company’s financial instruments are as follows:
December 31, 2013 Fair Value Measurement Using
(Dollars in millions)
Carrying
Amount
Fair
Val ue
Quoted Prices in
Active Markets
for Identical
Assets/Liabilities
(Level 1)
Significant
Other
Observable
Inputs
(Level 2)
Significant
Unobservable
Inputs
(Level 3)
Financial assets:
Cash and cash equivalents $5,263 $5,263 $5,263 $— $— (a)
Trading assets and derivatives 5,040 5,040 1,156 3,812 72 (b)
Securities AFS 22,542 22,542 1,396 20,193 953 (b)
LHFS 1,699 1,700 — 1,666 34 (c)
LHFI, net 125,833 121,341 — 2,860 118,481 (d)
Financial liabilities:
Deposits 129,759 129,801 — 129,801 — (e)
Short-term borrowings 8,739 8,739 — 8,739 — (f)
Long-term debt 10,700 10,678 — 10,086 592 (f)
Trading liabilities and derivatives 1,181 1,181 979 198 4 (b)
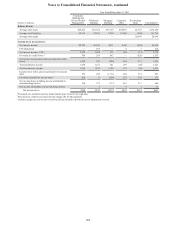
December 31, 2012 Fair Value Measurement Using
(Dollars in millions)
Carrying
Amount
Fair
Value
Quoted Prices in
Active Markets
for Identical
Assets/Liabilities
(Level 1)
Significant
Other
Observable
Inputs
(Level 2)
Significant
Unobservable
Inputs
(Level 3)
Financial assets:
Cash and cash equivalents $8,257 $8,257 $8,257 $— $— (a)
Trading assets and derivatives 6,227 6,227 696 5,341 190 (b)
Securities AFS 21,953 21,953 291 20,748 914 (b)
LHFS 3,399 3,399 — 3,375 24 (c)
LHFI, net 119,296 115,690 — 4,041 111,649 (d)
Financial liabilities:
Deposits 132,316 132,613 — 132,613 — (e)
Short-term borrowings 5,494 5,494 — 5,494 — (f)
Long-term debt 9,357 9,413 — 8,829 584 (f)
Trading liabilities and derivatives 1,176 1,176 891 285 — (b)
The following methods and assumptions were used by the Company in estimating the fair value of financial instruments:
(a) Cash and cash equivalents are valued at their carrying amounts reported in the balance sheet, which are reasonable
estimates of fair value due to the relatively short period to maturity of the instruments.
(b) Securities AFS, trading assets and derivatives, and trading liabilities and derivatives that are classified as level 1 are
valued based on quoted market prices. For those instruments classified as level 2 or 3, refer to the respective valuation
discussions within this footnote.
(c) LHFS are generally valued based on observable current market prices or, if quoted market prices are not available,
on quoted market prices of similar instruments. Refer to the LHFS section within this footnote for further discussion
of the LHFS carried at fair value. In instances for which significant valuation assumptions are not readily observable
in the market, instruments are valued based on the best available data to approximate fair value. This data may be
internally-developed and considers risk premiums that a market participant would require under then-current market
conditions.