SunTrust 2013 Annual Report Download - page 50
Download and view the complete annual report
Please find page 50 of the 2013 SunTrust annual report below. You can navigate through the pages in the report by either clicking on the pages listed below, or by using the keyword search tool below to find specific information within the annual report.-
 1
1 -
2
-
3
-
4
-
5
-
6
-
7
-
8
-
9
-
10
-
11
-
12
-
13
-
14
-
15
-
16
-
17
-
18
-
19
-
20
-
21
-
22
-
23
-
24
-
25
-
26
-
27
-
28
-
29
-
30
-
31
-
32
-
33
-
34
-
35
-
36
-
37
-
38
-
39
-
 40
40 -
 41
41 -
 42
42 -
 43
43 -
 44
44 -
 45
45 -
 46
46 -
 47
47 -
 48
48 -
 49
49 -
 50
50 -
 51
51 -
 52
52 -
 53
53 -
 54
54 -
 55
55 -
 56
56 -
 57
57 -
 58
58 -
 59
59 -
 60
60 -
61
-
62
-
63
-
64
-
65
-
66
-
67
-
68
-
69
-
70
-
71
-
72
-
73
-
74
-
75
-
76
-
77
-
78
-
79
-
80
-
81
-
82
-
83
-
84
-
85
-
86
-
87
-
88
-
89
-
90
-
91
-
92
-
93
-
94
-
95
-
96
-
97
-
98
-
99
-
100
-
101
-
102
-
103
-
104
-
105
-
106
-
107
-
108
-
109
-
110
-
111
-
112
-
113
-
114
-
115
-
116
-
117
-
118
-
119
-
120
-
121
-
122
-
123
-
124
-
125
-
126
-
127
-
128
-
129
-
130
-
131
-
132
-
133
-
134
-
135
-
136
-
137
-
138
-
139
-
140
-
141
-
142
-
143
-
144
-
145
-
146
-
147
-
148
-
149
-
150
-
151
-
152
-
153
-
154
-
155
-
156
-
157
-
158
-
159
-
160
-
161
-
162
-
163
-
164
-
165
-
166
-
167
-
168
-
169
-
170
-
171
-
172
-
173
-
174
-
175
-
176
-
177
-
178
-
179
-
180
-
181
-
182
-
183
-
184
-
185
-
186
-
187
-
188
-
189
-
190
-
191
-
192
-
193
-
194
-
195
-
196
-
197
-
198
-
199
-
200
-
201
-
202
-
203
-
204
-
205
-
206
-
207
-
208
-
209
-
210
-
211
-
212
-
213
-
214
-
215
-
216
-
217
-
218
-
219
-
220
-
221
-
222
-
223
-
224
-
225
-
226
-
227
-
228
-
229
-
230
-
231
-
232
-
233
-
234
-
235
-
236
 |
 |
34
EXECUTIVE OVERVIEW
Economic and regulatory
The economic landscape in 2013 reflected gradual improvement in economic activity and labor market conditions, increased
consumer confidence and household spending, and further strengthening of many housing markets in which we operate. As the
overall economy improved, increases in mortgage interest rates during the year resulted in a decline in mortgage refinance activity
from the strong levels in 2012. Despite the increase in mortgage interest rates, consumer borrowing costs remained at relatively
low levels which continued to be a catalyst to increased consumer spending. Consumer spending increased compared to 2012 and
during 2013 reached levels last seen prior to the recession, before declining at December 31, 2013, to a level moderately below
the prior year end. The unemployment rate dropped to below 7% at December 31, 2013, compared to the rate at December 31,
2012, which was slightly below 8%. The drop in unemployment and improvement in economic conditions during 2013 aided the
changes in U.S. monetary policy announced at the end of 2013, as discussed further below. The housing market continued to
strengthen in 2013, as demonstrated by continued price increases, favorable shifts in supply and demand, and some encouraging
signs from certain homebuilding activities. However, the rise in mortgage interest rates that began in the second quarter of 2013
applied pressure on the housing recovery and significantly impacted refinancing activity.
During 2013, the Federal Reserve maintained a highly accommodative monetary policy and indicated that this policy would remain
in effect for a considerable time after its asset purchase program ends and the economic recovery strengthens. Accordingly, the
Federal Reserve maintained key interest rates at exceptionally low levels during 2013, and indicated that they would likely remain
at these levels well past the time that the unemployment rate drops below 6.5%, especially if its long-term inflation goals are not
met. As a result of executing its monetary policy, the Federal Reserve continued to maintain large portfolios of U.S. Treasury notes
and bonds and agency MBS and continued adding Treasuries and agency MBS to its portfolio during 2013. However, during 2013,
driven in large part by the financial markets' expectations regarding future Federal Reserve monetary policy actions, certain market
interest rates increased and the yield curve steepened compared to December 31, 2012. During December 2013, the Federal Reserve
indicated that it would begin to modestly reduce its pace of Treasury and agency MBS purchases in January 2014 in light of
cumulative progress in unemployment and labor market conditions. The Federal Reserve indicated further that a reduction of its
asset purchases was likely with continued improving economic indicators, but that its asset purchases are not on a preset course
and the decision to moderate purchases further will be based on close monitoring of economic and financial developments over
the coming months and how these developments support any continued improvement in labor market conditions and inflation
objectives. Despite the currently planned moderation in asset purchases, the Federal Reserve indicated that, in its view, the sizable
and still increasing holdings of longer-term securities should maintain downward pressure on longer-term interest rates, support
mortgage markets, and allow more accommodative financial conditions. The Federal Reserve outlook includes economic growth
that will strengthen from current levels with appropriate policy accommodation, a gradual decline in unemployment, and the
expectation of gradually increasing longer-term inflation. See additional discussion regarding the increase in interest rates in the
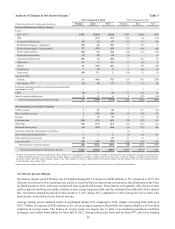
"Net Interest Income/Margin" and "Noninterest Income" sections of this MD&A.
Capital
During 2013, we announced capital plans in conjunction with the 2013 CCAR submission and completion of the Federal Reserve's
review of our capital plan. Accordingly, during 2013 we repurchased $150 million of our common stock, and we subsequently
repurchased an additional $50 million of our common stock in early 2014. Additionally, we increased our quarterly common stock
dividend by $0.05 per common share effective in the second quarter of 2013, which resulted in dividends for 2013 of $0.35 per
common share, an increase from $0.20 per common share in 2012. We have submitted our 2014 capital plan in conjunction with
the 2014 CCAR submission, and upon completion of the Federal Reserve's review of the capital plan, we will announce any future
capital actions.
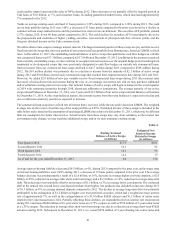
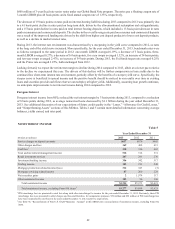
At December 31, 2013 our capital ratios were well above the requirements to be considered “well capitalized” according to current
and expected future regulatory standards, as earnings during 2013 drove a $1.1 billion increase in our Tier 1 common equity. Our
Tier 1 common equity ratio was 9.82% at December 31, 2013, compared to 10.04% at December 31, 2012. The decline in the ratio
compared to the prior year was primarily due to an increase in RWA as a result of loan growth and an increase in unused lending
commitments. Our Tier 1 capital and total capital ratios were 10.81% and 12.81%, respectively, at December 31, 2013 compared
to 11.13% and 13.48%, respectively, at December 31, 2012, which also declined moderately from the prior year primarily due to
the same reasons as the decline in the Tier 1 common equity ratio. See additional discussion of our capital and liquidity position
in the “Capital Resources” and “Liquidity Risk Management” sections of this MD&A.
The Federal Reserve published final rules on October 11, 2013 related to capital adequacy requirements to implement the BCBS's
Basel III framework for financial institutions in the U.S. The final rules become effective for us on January 1, 2015, and, based
on our current analysis of the rules, we believe that our RWA will increase slightly primarily due to increased risk-weightings for
MSRs and certain on and off-balance sheet exposures, resulting in a small decline in our capital ratios. Based on our current and
ongoing analysis of the recently published rules, we estimate our current Basel III common equity Tier 1 ratio, on a fully phased-