SunTrust 2013 Annual Report Download - page 56
Download and view the complete annual report
Please find page 56 of the 2013 SunTrust annual report below. You can navigate through the pages in the report by either clicking on the pages listed below, or by using the keyword search tool below to find specific information within the annual report.-
 1
1 -
2
-
3
-
4
-
5
-
6
-
7
-
8
-
9
-
10
-
11
-
12
-
13
-
14
-
15
-
16
-
17
-
18
-
19
-
20
-
21
-
22
-
23
-
24
-
25
-
26
-
27
-
28
-
29
-
30
-
31
-
32
-
33
-
34
-
35
-
36
-
37
-
38
-
39
-
40
-
41
-
42
-
43
-
44
-
45
-
 46
46 -
 47
47 -
 48
48 -
 49
49 -
 50
50 -
 51
51 -
 52
52 -
 53
53 -
 54
54 -
 55
55 -
 56
56 -
 57
57 -
 58
58 -
 59
59 -
 60
60 -
 61
61 -
 62
62 -
 63
63 -
 64
64 -
 65
65 -
 66
66 -
67
-
68
-
69
-
70
-
71
-
72
-
73
-
74
-
75
-
76
-
77
-
78
-
79
-
80
-
81
-
82
-
83
-
84
-
85
-
86
-
87
-
88
-
89
-
90
-
91
-
92
-
93
-
94
-
95
-
96
-
97
-
98
-
99
-
100
-
101
-
102
-
103
-
104
-
105
-
106
-
107
-
108
-
109
-
110
-
111
-
112
-
113
-
114
-
115
-
116
-
117
-
118
-
119
-
120
-
121
-
122
-
123
-
124
-
125
-
126
-
127
-
128
-
129
-
130
-
131
-
132
-
133
-
134
-
135
-
136
-
137
-
138
-
139
-
140
-
141
-
142
-
143
-
144
-
145
-
146
-
147
-
148
-
149
-
150
-
151
-
152
-
153
-
154
-
155
-
156
-
157
-
158
-
159
-
160
-
161
-
162
-
163
-
164
-
165
-
166
-
167
-
168
-
169
-
170
-
171
-
172
-
173
-
174
-
175
-
176
-
177
-
178
-
179
-
180
-
181
-
182
-
183
-
184
-
185
-
186
-
187
-
188
-
189
-
190
-
191
-
192
-
193
-
194
-
195
-
196
-
197
-
198
-
199
-
200
-
201
-
202
-
203
-
204
-
205
-
206
-
207
-
208
-
209
-
210
-
211
-
212
-
213
-
214
-
215
-
216
-
217
-
218
-
219
-
220
-
221
-
222
-
223
-
224
-
225
-
226
-
227
-
228
-
229
-
230
-
231
-
232
-
233
-
234
-
235
-
236
 |
 |

40
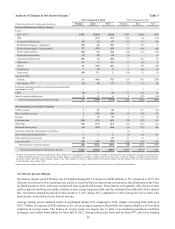
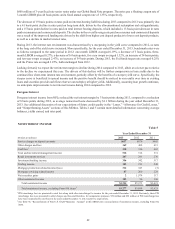
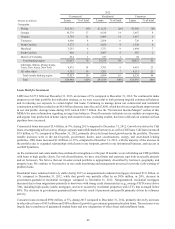
Analysis of Changes in Net Interest Income 1Table 3
2013 Compared to 2012 2012 Compared to 2011
(Dollars in millions on a taxable-equivalent basis) Volume Rate Net Volume Rate Net
Increase/(Decrease) in Interest Income
Loans:
C&I - FTE 2$155 ($303) ($148) $250 ($289) ($39)
CRE — (19) (19) (29) (4) (33)
Commercial construction (4) (3) (7) (13) (1) (14)
Residential mortgages - guaranteed (53) (6) (59) 31 (23) 8
Residential mortgages - nonguaranteed 17 (82) (65) 34 (99) (65)
Home equity products (18) (8) (26) (32) (11) (43)
Residential construction (7) (2) (9) (9) — (9)
Guaranteed student loans (55) (3) (58) 77 (21) 56
Other direct 13 1 14 16 (8) 8
Indirect 22 (48) (26) 33 (69) (36)
Credit cards 7(2)5 6 (8) (2)
Nonaccrual (19) 21 2 (14) 11 (3)
Securities AFS:
Taxable 15 (86) (71) (65) (65) (130)
Tax-exempt - FTE 2(6) (1) (7) (7) (1) (8)
Fed funds sold and securities borrowed or purchased under
agreements to resell ——— —11
LHFS (6) 1 (5) 36 (18) 18
Interest earning trading assets 224 8 (22) (14)
Total increase/(decrease) in interest income 63 (538) (475) 322 (627) (305)
(Decrease)/Increase in Interest Expense
NOW accounts 1 (7) (6) 1 (13) (12)
Money market accounts 1 (35) (34) (3) (70) (73)
Savings 1 (3) (2) 1 (3) (2)
Consumer time (20) (23) (43) (28) (25) (53)
Other time (14) (13) (27) (17) (14) (31)
Brokered time deposits (6) (20) (26) (4) (20) (24)
Securities sold under agreements to repurchase ——— (1) 1 —
Interest-bearing trading liabilities 112(5) (6) (11)
Other short-term borrowings (5) — (5) 10 (4) 6
Long-term debt (45) (44) (89) (52) (99) (151)
Total decrease in interest expense (86) (144) (230) (98) (253) (351)
Net increase/(decrease) in net interest income $149 ($394) ($245) $420 ($374) $46
1 Changes in net interest income are attributed to either changes in average balances (volume change) or changes in average rates (rate change) for earning assets and sources
of funds on which interest is received or paid. Volume change is calculated as change in volume times the previous rate, while rate change is change in rate times the
previous volume. The rate/volume change, change in rate times change in volume, is allocated between volume change and rate change at the ratio each component bears
to the absolute value of their total.
2 Interest income includes the effects of the taxable-equivalent adjustments to increase tax-exempt interest income to a taxable-equivalent basis.
Net Interest Income/Margin
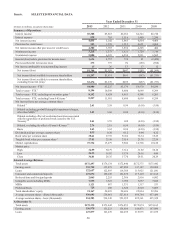
Net interest income on an FTE basis was $5.0 billion during 2013, a decrease of $245 million, or 5%, compared to 2012. The
decrease was driven by lower earning asset yields as a result of the low interest rate environment, the elimination of the Coke
dividend income in 2012, and lower commercial loan swap-related income. These factors were partially offset by lower rates
paid on deposits and long-term debt, a decline in our average long-term debt, and the continued favorable shift in the deposit
mix. Net interest margin decreased 16 basis points to 3.24% during 2013, compared to 3.40% during 2012 as a result of the
same factors as the decline in net interest income.
Average earning assets remained relatively unchanged during 2013 compared to 2012, slightly increasing $249 million to
$153.7 billion. An increase of $398 million, or 2%, in our average securities AFS portfolio was largely offset by a $236 million
reduction in average loans. The decline in average loans was largely due to sales of government-guaranteed residential
mortgages and student loans during the latter half of 2012. Average nonaccrual loans also declined 47%, driven by ongoing