SunTrust 2013 Annual Report Download - page 70
Download and view the complete annual report
Please find page 70 of the 2013 SunTrust annual report below. You can navigate through the pages in the report by either clicking on the pages listed below, or by using the keyword search tool below to find specific information within the annual report.-
 1
1 -
2
-
3
-
4
-
5
-
6
-
7
-
8
-
9
-
10
-
11
-
12
-
13
-
14
-
15
-
16
-
17
-
18
-
19
-
20
-
21
-
22
-
23
-
24
-
25
-
26
-
27
-
28
-
29
-
30
-
31
-
32
-
33
-
34
-
35
-
36
-
37
-
38
-
39
-
40
-
41
-
42
-
43
-
44
-
45
-
46
-
47
-
48
-
49
-
50
-
51
-
52
-
53
-
54
-
55
-
56
-
57
-
58
-
59
-
 60
60 -
 61
61 -
 62
62 -
 63
63 -
 64
64 -
 65
65 -
 66
66 -
 67
67 -
 68
68 -
 69
69 -
 70
70 -
 71
71 -
 72
72 -
 73
73 -
 74
74 -
 75
75 -
 76
76 -
 77
77 -
 78
78 -
 79
79 -
 80
80 -
81
-
82
-
83
-
84
-
85
-
86
-
87
-
88
-
89
-
90
-
91
-
92
-
93
-
94
-
95
-
96
-
97
-
98
-
99
-
100
-
101
-
102
-
103
-
104
-
105
-
106
-
107
-
108
-
109
-
110
-
111
-
112
-
113
-
114
-
115
-
116
-
117
-
118
-
119
-
120
-
121
-
122
-
123
-
124
-
125
-
126
-
127
-
128
-
129
-
130
-
131
-
132
-
133
-
134
-
135
-
136
-
137
-
138
-
139
-
140
-
141
-
142
-
143
-
144
-
145
-
146
-
147
-
148
-
149
-
150
-
151
-
152
-
153
-
154
-
155
-
156
-
157
-
158
-
159
-
160
-
161
-
162
-
163
-
164
-
165
-
166
-
167
-
168
-
169
-
170
-
171
-
172
-
173
-
174
-
175
-
176
-
177
-
178
-
179
-
180
-
181
-
182
-
183
-
184
-
185
-
186
-
187
-
188
-
189
-
190
-
191
-
192
-
193
-
194
-
195
-
196
-
197
-
198
-
199
-
200
-
201
-
202
-
203
-
204
-
205
-
206
-
207
-
208
-
209
-
210
-
211
-
212
-
213
-
214
-
215
-
216
-
217
-
218
-
219
-
220
-
221
-
222
-
223
-
224
-
225
-
226
-
227
-
228
-
229
-
230
-
231
-
232
-
233
-
234
-
235
-
236
 |
 |
54
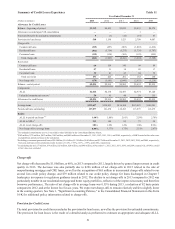
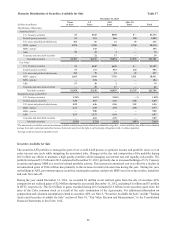
Nonaccrual loans, loans over 90 days past due and still accruing, and TDR loans, are problem loans or loans with potential
weaknesses that are disclosed in the NPA table above. Loans with known potential credit problems that may not otherwise
be disclosed in this table include accruing criticized commercial loans, which are disclosed along with additional credit quality
information in Note 6, “Loans,” to the Consolidated Financial Statements in this Form 10-K. At December 31, 2013 and
December 31, 2012, there were no known significant potential problem loans that are not otherwise disclosed.
Nonperforming Loans
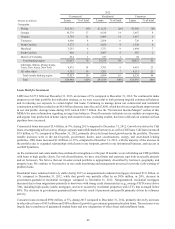
Nonperforming commercial loans decreased $47 million, or 16%, during 2013 compared to 2012 with reductions in CRE
NPLs of $27 million, or 41%, and $22 million, or 65%, in commercial construction NPLs.
Nonperforming residential loans were the largest driver of the overall decline in NPLs, decreasing $516 million, or 42%,
during 2013 compared to 2012. The reduction in nonguaranteed residential mortgage NPLs and home equity NPLs accounted
for $334 million and $131 million, respectively, of this decrease, and was primarily the result of the return of certain performing
Chapter 7 bankruptcy loans to accruing status, net charge-offs, pay-offs, improved loan performance, and foreclosures.
Additionally, residential construction NPLs decreased $51 million, primarily as a result of net charge-offs.
Interest income on consumer and residential nonaccrual loans, if recognized, is recognized on a cash basis. Interest income
on commercial nonaccrual loans is not generally recognized until after the principal has been reduced to zero. We recognized
$33 million and $31 million of interest income related to nonaccrual loans during 2013 and 2012, respectively. If all such
loans had been accruing interest according to their original contractual terms, estimated interest income of $73 million and
$147 million during 2013 and 2012, respectively, would have been recognized.
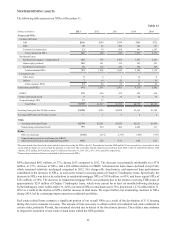
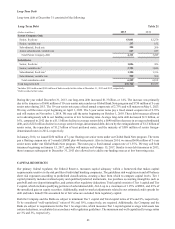
Other Nonperforming Assets
OREO decreased $94 million, or 36%, during 2013 compared to 2012 as a result of net decreases of $56 million in residential
construction related properties, $34 million in commercial properties, and $4 million in residential homes. Sales of OREO
resulted in proceeds of $356 million and $493 million during 2013 and 2012, respectively, contributing to net gains on sales
of OREO of $69 million and $34 million, respectively, inclusive of valuation reserves. We do not expect to see a continuation
of net gains on sale in future periods given the elevated level of gains during 2013. Gains and losses on the sale of OREO are
recorded in other real estate expense in the Consolidated Statements of Income. Sales of OREO and the related gains or losses
are highly dependent on our disposition strategy and buyer opportunities. See Note 18, “Fair Value Election and Measurement,”
to the Consolidated Financial Statements in this Form 10-K for additional information.
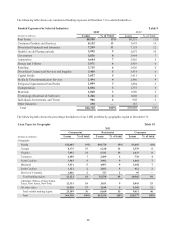
Geographically, most of our OREO properties are located in Florida, Georgia, and North Carolina. Residential and commercial
properties comprised 69% and 19%, respectively, of OREO at December 31, 2013; the remainder is related to land and other
properties. Upon foreclosure, the values of these properties were reevaluated and, if necessary, written down to their then-
current estimated value less estimated costs to sell. Any further decreases in values could result in additional losses on these
properties as we periodically revalue them as further discussed in Note 18, "Fair Value Election and Measurement," to the
Consolidated Financial Statements in this Form 10-K. We are actively managing and disposing of these foreclosed assets to
minimize future losses.
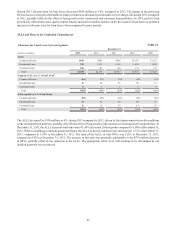
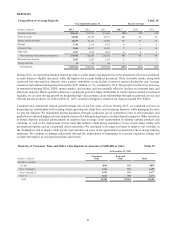
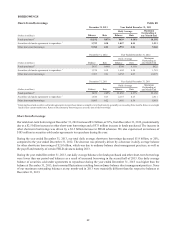
At December 31, 2013 and 2012, total accruing loans past due ninety days or more included LHFI and LHFS and totaled $1.2
billion and $783 million, respectively. Accruing LHFI past due ninety days or more increased by $446 million, or 57%, during
2013, primarily driven by guaranteed student loan delinquencies. Residential mortgages and student loans that are guaranteed
by a federal agency comprised 96% and 92%, respectively, of loans 90 days or more past due and still accruing at December
31, 2013 and 2012, respectively. At the same dates, $48 million and $60 million, respectively, of accruing loans past due
ninety days or more were not guaranteed.
Restructured Loans
To maximize the collection of loan balances, we evaluate troubled loans on a case-by-case basis to determine if a loan
modification would be appropriate. We pursue loan modifications when there is a reasonable chance that an appropriate
modification would allow our client to continue servicing the debt. For loans secured by residential real estate, if the client
demonstrates a loss of income such that the client cannot reasonably support a modified loan, we may pursue short sales and/
or deed-in-lieu arrangements. For loans secured by income producing commercial properties, we perform an in-depth and
ongoing programmatic review. We review a number of factors, including cash flows, loan structures, collateral values, and
guarantees to identify loans within our income producing commercial loan portfolio that are most likely to experience distress.
Based on our review of these factors and our assessment of overall risk, we evaluate the benefits of proactively initiating
discussions with our clients to improve a loan’s risk profile. In some cases, we may renegotiate terms of their loans so that