SunTrust 2013 Annual Report Download - page 108
Download and view the complete annual report
Please find page 108 of the 2013 SunTrust annual report below. You can navigate through the pages in the report by either clicking on the pages listed below, or by using the keyword search tool below to find specific information within the annual report.-
 1
1 -
2
-
3
-
4
-
5
-
6
-
7
-
8
-
9
-
10
-
11
-
12
-
13
-
14
-
15
-
16
-
17
-
18
-
19
-
20
-
21
-
22
-
23
-
24
-
25
-
26
-
27
-
28
-
29
-
30
-
31
-
32
-
33
-
34
-
35
-
36
-
37
-
38
-
39
-
40
-
41
-
42
-
43
-
44
-
45
-
46
-
47
-
48
-
49
-
50
-
51
-
52
-
53
-
54
-
55
-
56
-
57
-
58
-
59
-
60
-
61
-
62
-
63
-
64
-
65
-
66
-
67
-
68
-
69
-
70
-
71
-
72
-
73
-
74
-
75
-
76
-
77
-
78
-
79
-
80
-
81
-
82
-
83
-
84
-
85
-
86
-
87
-
88
-
89
-
90
-
91
-
92
-
93
-
94
-
95
-
96
-
97
-
 98
98 -
 99
99 -
 100
100 -
 101
101 -
 102
102 -
 103
103 -
 104
104 -
 105
105 -
 106
106 -
 107
107 -
 108
108 -
 109
109 -
 110
110 -
 111
111 -
 112
112 -
 113
113 -
 114
114 -
 115
115 -
 116
116 -
 117
117 -
 118
118 -
119
-
120
-
121
-
122
-
123
-
124
-
125
-
126
-
127
-
128
-
129
-
130
-
131
-
132
-
133
-
134
-
135
-
136
-
137
-
138
-
139
-
140
-
141
-
142
-
143
-
144
-
145
-
146
-
147
-
148
-
149
-
150
-
151
-
152
-
153
-
154
-
155
-
156
-
157
-
158
-
159
-
160
-
161
-
162
-
163
-
164
-
165
-
166
-
167
-
168
-
169
-
170
-
171
-
172
-
173
-
174
-
175
-
176
-
177
-
178
-
179
-
180
-
181
-
182
-
183
-
184
-
185
-
186
-
187
-
188
-
189
-
190
-
191
-
192
-
193
-
194
-
195
-
196
-
197
-
198
-
199
-
200
-
201
-
202
-
203
-
204
-
205
-
206
-
207
-
208
-
209
-
210
-
211
-
212
-
213
-
214
-
215
-
216
-
217
-
218
-
219
-
220
-
221
-
222
-
223
-
224
-
225
-
226
-
227
-
228
-
229
-
230
-
231
-
232
-
233
-
234
-
235
-
236
 |
 |
92
Years Ended December 31, 2012 vs. 2011
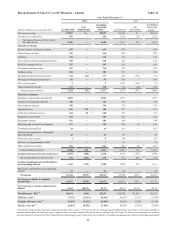
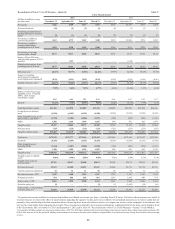
Consumer Banking and Private Wealth Management
Consumer Banking and Private Wealth Management reported net income of $310 million during the year ended December
31, 2012, a decrease of $40 million, or 11%, compared to 2011. The decrease in net income was due to lower noninterest
income and higher noninterest expenses, partially offset by lower provision for credit losses.
Net interest income was $2.7 billion during 2012, a decrease of $6 million compared to 2011. The decrease was driven by
lower loan and deposit spreads, partially offset by the impact of higher average loan balances. Net interest income related to
loans increased $17 million, or 2%, compared to the prior year driven by a $1.6 billion, or 4%, increase in average loan
balances, partially offset by a decrease in loan spreads of six basis points. The increase in average loans was driven by the
fourth quarter of 2011 acquisitions of student loan portfolios and higher production in indirect auto loans, partially offset by
decreases in equity lines, commercial real estate, and residential mortgages. Other funding costs related to other assets improved
by $28 million, driven primarily by a decline in funding rates. Net interest income related to client deposits decreased $52
million, or 3%, compared to the same period in 2011. The decrease in net interest income was driven by a five basis point
decline in deposit spreads and a $560 million decrease in average client deposit balances.
Provision for credit losses was $645 million during 2012, a decrease of $144 million, or 18%, compared to 2011. The decrease
was driven by declines in net charge-offs of $70 million in home equity lines, $31 million in commercial, $17 million in
indirect, $17 million in credit card, and $10 million in residential mortgage loans. Included in these amounts were $43 million
of incremental charge-offs related to a change in credit policy accelerating the charge-off of second lien loans from 180 days
to 120 days past due and $31 million of incremental charge-offs related to a change in policy to recognize charge-offs on loans
discharged in Chapter 7 bankruptcy. See additional discussion of credit and asset quality in the “Loans,” “Allowance for Credit
Losses,” and “Nonperforming Assets” sections of this MD&A.
Total noninterest income was $1.5 billion during 2012, a decrease of $178 million, or 11%, compared to 2011. Card fees
decreased $153 million compared to 2011 driven by regulations on debit interchange fee income that became effective during
2011. Additionally, there was a $20 million decline in trust and investment management income influenced by clients' desires
for additional liquidity, along with a $16 million decline in service charges on deposit accounts, partially offset by a $12
million increase in retail investment income.
Total noninterest expense was $3.1 billion during 2012, an increase of $22 million, or 1%, compared to 2011. The increase
was driven by corporate overhead allocations that offset a decrease in expenses managed by the business, such as reduced
staff expense, other real estate, advertising, other staff, and operating supplies expense.
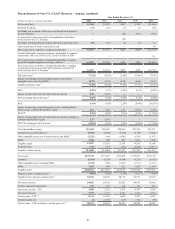
Wholesale Banking
Wholesale Banking reported net income of $698 million during the year ended December 31, 2012, an increase of $428
million, compared to 2011. The increase was attributable to decreases in provision for credit losses and noninterest expense
combined with increases in both net interest income and noninterest income.
Net interest income was $1.7 billion during 2012, an increase of $165 million, or 11%, compared to 2011, driven by higher
loan and deposit balances. Net interest income related to loans increased $94 million, or 10%, as average loan balances
increased $3.8 billion, or 8%, driven by increases in commercial domestic and tax-exempt loans, partially offset by decreases
in CRE loans. Net interest income related to deposits increased $51 million, or 9%, resulting from a $3.6 billion, or 10%,
increase in client deposit balances. Favorable trends in deposit mix continued as lower cost demand deposits increased $4.3
billion, or 27%, while average interest-bearing transaction accounts and money market accounts decreased a combined $608
million, or 3%.
Provision for credit losses was $266 million during 2012, a decrease of $293 million, or 52%, compared to 2011. The decrease
was driven by lower net charge-offs in CRE, commercial domestic, and residential mortgage loans.
Total noninterest income was $1.4 billion during 2012, an increase of $182 million, or 15%, compared to 2011, predominantly
driven by increased trading revenue, investment banking revenue, service charges on deposit accounts, card services, and non
margin loan fees. These increases were partially offset by declines in letter of credit fees and other miscellaneous income.