SunTrust 2013 Annual Report Download - page 179
Download and view the complete annual report
Please find page 179 of the 2013 SunTrust annual report below. You can navigate through the pages in the report by either clicking on the pages listed below, or by using the keyword search tool below to find specific information within the annual report.-
 1
1 -
2
-
3
-
4
-
5
-
6
-
7
-
8
-
9
-
10
-
11
-
12
-
13
-
14
-
15
-
16
-
17
-
18
-
19
-
20
-
21
-
22
-
23
-
24
-
25
-
26
-
27
-
28
-
29
-
30
-
31
-
32
-
33
-
34
-
35
-
36
-
37
-
38
-
39
-
40
-
41
-
42
-
43
-
44
-
45
-
46
-
47
-
48
-
49
-
50
-
51
-
52
-
53
-
54
-
55
-
56
-
57
-
58
-
59
-
60
-
61
-
62
-
63
-
64
-
65
-
66
-
67
-
68
-
69
-
70
-
71
-
72
-
73
-
74
-
75
-
76
-
77
-
78
-
79
-
80
-
81
-
82
-
83
-
84
-
85
-
86
-
87
-
88
-
89
-
90
-
91
-
92
-
93
-
94
-
95
-
96
-
97
-
98
-
99
-
100
-
101
-
102
-
103
-
104
-
105
-
106
-
107
-
108
-
109
-
110
-
111
-
112
-
113
-
114
-
115
-
116
-
117
-
118
-
119
-
120
-
121
-
122
-
123
-
124
-
125
-
126
-
127
-
128
-
129
-
130
-
131
-
132
-
133
-
134
-
135
-
136
-
137
-
138
-
139
-
140
-
141
-
142
-
143
-
144
-
145
-
146
-
147
-
148
-
149
-
150
-
151
-
152
-
153
-
154
-
155
-
156
-
157
-
158
-
159
-
160
-
161
-
162
-
163
-
164
-
165
-
166
-
167
-
168
-
 169
169 -
 170
170 -
 171
171 -
 172
172 -
 173
173 -
 174
174 -
 175
175 -
 176
176 -
 177
177 -
 178
178 -
 179
179 -
 180
180 -
 181
181 -
 182
182 -
 183
183 -
 184
184 -
 185
185 -
 186
186 -
 187
187 -
 188
188 -
 189
189 -
190
-
191
-
192
-
193
-
194
-
195
-
196
-
197
-
198
-
199
-
200
-
201
-
202
-
203
-
204
-
205
-
206
-
207
-
208
-
209
-
210
-
211
-
212
-
213
-
214
-
215
-
216
-
217
-
218
-
219
-
220
-
221
-
222
-
223
-
224
-
225
-
226
-
227
-
228
-
229
-
230
-
231
-
232
-
233
-
234
-
235
-
236
 |
 |

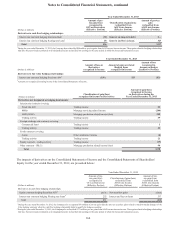
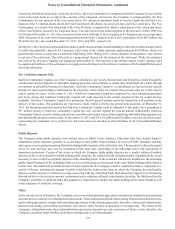
Notes to Consolidated Financial Statements, continued
163
December 31, 2012
Asset Derivatives Liability Derivatives
(Dollars in millions)
Notional
Amounts
Fair
Value
Notional
Amounts
Fair
Value
Derivatives designated in cash flow hedging relationships 1
Interest rate contracts hedging floating rate loans $17,350 $771 $— $—
Derivatives designated in fair value hedging relationships 2
Interest rate contracts covering fixed rate debt 1,000 61 — —
Derivatives not designated as hedging instruments 3
Interest rate contracts covering:
Fixed rate debt — — 60 10
MSRs 6,185 150 12,643 33
LHFS, IRLCs, LHFI-FV 42,333 6 7,076 15
Trading activity 581,930 6,044 86,037 5,777
Foreign exchange rate contracts covering:
Foreign-denominated debt and commercial loans — —34 —
Trading activity 2,451 66 2,326 63
Credit contracts covering:
Loans — — 445 8
Trading activity 61,958 55 2,081 49
Equity contracts - Trading activity 515,748 1,342 22,184 1,529
Other contracts:
IRLCs and other 76,783 132 142 1
Commodities 255 29 255 29
Total 117,643 7,824 133,283 7,514
Total derivatives $135,993 $8,656 $133,283 $7,514
Total gross derivatives, before netting $8,656 $7,514
Less: Legally enforceable master netting agreements (5,843) (5,843)
Less: Cash collateral received/paid (730) (1,259)
Total derivatives, after netting $2,083 $412
1 See “Cash Flow Hedges” in this Note for further discussion.
2 See “Fair Value Hedges” in this Note for further discussion.
3 See “Economic Hedging and Trading Activities” in this Note for further discussion.
4 Amount includes $1.7 billion of notional amounts related to interest rate futures. These futures contracts settle in cash daily, one day in arrears. The derivative
liability associated with the one day lag is included in the fair value column of this table.
5 Amounts include $16.2 billion and $0.8 billion of notional related to interest rate futures and equity futures, respectively. These futures contracts settle in cash
daily, one day in arrears. The derivative asset associated with the one day lag is included in the fair value column of this table.
6 Asset and liability amounts each include $3 million of notional from purchased and written interest rate swap risk participation agreements, respectively,
whose notional is calculated as the notional of the interest rate swap participated adjusted by the relevant RWA conversion factor.
7 Includes a notional amount that is based on the number of Visa Class B shares, 3.2 million, the conversion ratio from Class B shares to Class A shares, and
the Class A share price at the derivative inception date of May 28, 2009. This derivative was established upon the sale of Class B shares in the second quarter
of 2009 as discussed in Note 17, “Guarantees.” The fair value of the derivative liability, which relates to a notional amount of $134 million, is immaterial and
is recognized in other liabilities in the Consolidated Balance Sheets.
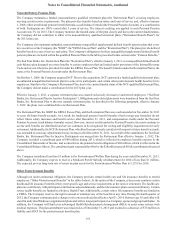
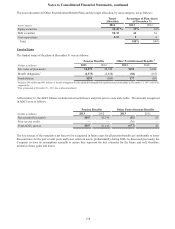
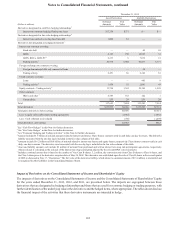
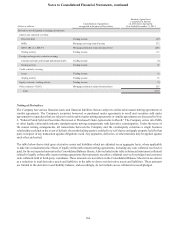
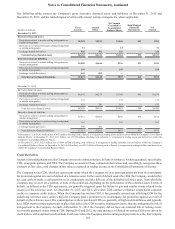
Impact of Derivatives on the Consolidated Statements of Income and Shareholders’ Equity
The impacts of derivatives on the Consolidated Statements of Income and the Consolidated Statements of Shareholders’ Equity
for the years ended December 31, 2013, 2012, and 2011, are presented below. The impacts are segregated between those
derivatives that are designated in hedging relationships and those that are used for economic hedging or trading purposes, with
further identification of the underlying risks in the derivatives and the hedged items, where appropriate. The tables do not disclose
the financial impact of the activities that these derivative instruments are intended to hedge.