SunTrust 2013 Annual Report Download - page 104
Download and view the complete annual report
Please find page 104 of the 2013 SunTrust annual report below. You can navigate through the pages in the report by either clicking on the pages listed below, or by using the keyword search tool below to find specific information within the annual report.-
 1
1 -
2
-
3
-
4
-
5
-
6
-
7
-
8
-
9
-
10
-
11
-
12
-
13
-
14
-
15
-
16
-
17
-
18
-
19
-
20
-
21
-
22
-
23
-
24
-
25
-
26
-
27
-
28
-
29
-
30
-
31
-
32
-
33
-
34
-
35
-
36
-
37
-
38
-
39
-
40
-
41
-
42
-
43
-
44
-
45
-
46
-
47
-
48
-
49
-
50
-
51
-
52
-
53
-
54
-
55
-
56
-
57
-
58
-
59
-
60
-
61
-
62
-
63
-
64
-
65
-
66
-
67
-
68
-
69
-
70
-
71
-
72
-
73
-
74
-
75
-
76
-
77
-
78
-
79
-
80
-
81
-
82
-
83
-
84
-
85
-
86
-
87
-
88
-
89
-
90
-
91
-
92
-
93
-
 94
94 -
 95
95 -
 96
96 -
 97
97 -
 98
98 -
 99
99 -
 100
100 -
 101
101 -
 102
102 -
 103
103 -
 104
104 -
 105
105 -
 106
106 -
 107
107 -
 108
108 -
 109
109 -
 110
110 -
 111
111 -
 112
112 -
 113
113 -
 114
114 -
115
-
116
-
117
-
118
-
119
-
120
-
121
-
122
-
123
-
124
-
125
-
126
-
127
-
128
-
129
-
130
-
131
-
132
-
133
-
134
-
135
-
136
-
137
-
138
-
139
-
140
-
141
-
142
-
143
-
144
-
145
-
146
-
147
-
148
-
149
-
150
-
151
-
152
-
153
-
154
-
155
-
156
-
157
-
158
-
159
-
160
-
161
-
162
-
163
-
164
-
165
-
166
-
167
-
168
-
169
-
170
-
171
-
172
-
173
-
174
-
175
-
176
-
177
-
178
-
179
-
180
-
181
-
182
-
183
-
184
-
185
-
186
-
187
-
188
-
189
-
190
-
191
-
192
-
193
-
194
-
195
-
196
-
197
-
198
-
199
-
200
-
201
-
202
-
203
-
204
-
205
-
206
-
207
-
208
-
209
-
210
-
211
-
212
-
213
-
214
-
215
-
216
-
217
-
218
-
219
-
220
-
221
-
222
-
223
-
224
-
225
-
226
-
227
-
228
-
229
-
230
-
231
-
232
-
233
-
234
-
235
-
236
 |
 |

88
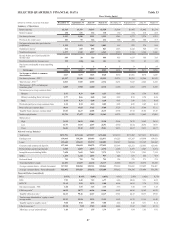
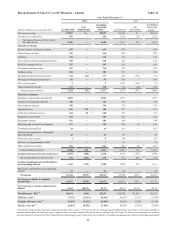
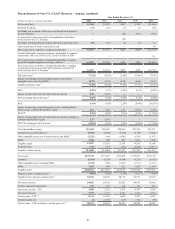
Total NPAs to total loans
plus OREO, other repossessed assets, and
nonperforming LHFS 0.91 1.04 1.14 1.44 1.52 1.71 2.24 2.54
Common dividend payout ratio 13.0 30.1 14.8 7.9 7.7 2.5 10.0 11.0
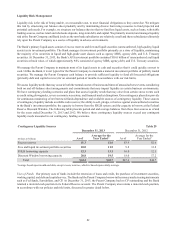
Capital Adequacy
Tier 1 common equity 9.82% 9.94% 10.19% 10.13% 10.04% 9.82% 9.40% 9.33%
Tier 1 capital 10.81 10.97 11.24 11.20 11.13 10.57 10.15 11.00
Total capital 12.81 13.04 13.43 13.45 13.48 12.95 12.84 13.73
Tier 1 leverage 9.58 9.46 9.40 9.26 8.91 8.49 8.15 8.77
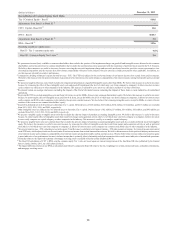
1 Includes net securities gains $1 $— $— $2 $1 $1,941 $14 $18
2 See Non-GAAP reconcilements in Table 37 of this MD&A.
3 Computed by dividing noninterest expense by total revenue-FTE. The FTE basis adjusts for the tax-favored status of net interest income from certain loans and investments. We
believe this measure to be the preferred industry measurement of net interest income and it enhances comparability of net interest income arising from taxable and tax-exempt
sources.
4 “NM” - not meaningful.
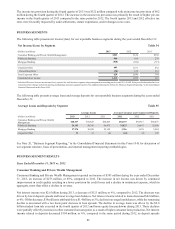
FOURTH QUARTER 2013 RESULTS
We reported net income available to common shareholders of $413 million during the fourth quarter of 2013, an increase of
$63 million, or 18%, compared with the same period of the prior year. Earnings per average common diluted share were $0.77
for the fourth quarter of 2013, compared with $0.65 for the fourth quarter of 2012. Lower provision for credit losses as a result
of the continued improvement in credit quality, expense management, and declines in credit-related cyclical costs offset a
decline in revenue to drive the increase in net income available to common shareholders.
During the fourth quarter of 2013, net interest income on a FTE basis was $1.2 billion, a decrease of $29 million, or 2%,
compared to the fourth quarter of 2012. The reduction in net interest income was due to lower yields on earning assets, partially
offset by higher average earning assets and lower interest expense driven by a favorable shift in deposit mix and an overall
decline in deposit rates paid. Net interest margin decreased 16 basis points to 3.20% during the fourth quarter of 2013 compared
to 3.36% for the same period in 2012. The decrease was primarily due to a 22 basis point decline in earning asset yields,
partially offset by a seven basis point reduction in interest-bearing liability rates, primarily related to a favorable shift in deposit
mix.
The provision for credit losses was $101 million during the fourth quarter of 2013, a decrease of $227 million, or 69%,
compared to the fourth quarter of 2012. The decrease was due to continued improvement in asset quality in 2013 and the
increased charge-offs in the fourth quarter of 2012 related to NPL sales and the policy change related to Chapter 7 bankruptcy
loans. See additional discussion of policy information in Note 1, "Significant Accounting Policies," to the Consolidated
Financial Statements in this Form 10-K.
Total noninterest income was $814 million for the fourth quarter of 2013, a decrease of $201 million, or 20%, compared to
the fourth quarter of 2012. This decrease was primarily driven by lower mortgage production related and investment banking
income, partially offset by lower valuation losses on the Company's fair value debt and an increase in other noninterest income.
Mortgage production related income during the fourth quarter of 2013 was $31 million compared to $241 million during the
fourth quarter of 2012, a $210 million decrease driven by a decline in production volume and gain on sale margins as market
interest rates increased. Investment banking income decreased $16 million during the fourth quarter of 2013 compared to the
fourth quarter of 2012, due to a decline in fixed income origination revenue, partially offset by growth in mergers and
acquisitions advisory and equity offering fees. Other noninterest income increased $37 million during the fourth quarter of
2013 compared to the fourth quarter of 2012, primarily due to $25 million of net losses related to the sale of Ginnie Mae loans
in the fourth quarter of 2012.
Total noninterest expense was $1.4 billion during the fourth quarter of 2013, a decrease of $133 million, or 9%, compared to
the fourth quarter of 2012. The decrease was a result of declines in almost all noninterest expense categories due to improved
expense management and declines in cyclical costs. Specifically, the decreases were driven by other noninterest expense of
$58 million, operating losses of $35 million, employee compensation and benefits expense of $15 million, and FDIC insurance
and regulatory expense of $13 million. The decrease in other noninterest expense was primarily driven by declines in other
real estate, consulting and legal, and credit and collections expenses due to declines in cyclical costs and the recognition of
certain legacy mortgage items. Operating losses declined in 2013 due to a $32 million accrual for our portion of the Consent
Order related to the Independent Foreclosure Review in the fourth quarter of 2012. The decrease in employee compensation
and benefits expense was primarily due to lower incentive compensation and employee benefit costs. The decrease in FDIC
insurance and regulatory expense compared to the fourth quarter of 2012 was due to a decrease in our FDIC insurance
assessment rate, reflecting our reduced risk profile.