SunTrust 2013 Annual Report Download - page 69
Download and view the complete annual report
Please find page 69 of the 2013 SunTrust annual report below. You can navigate through the pages in the report by either clicking on the pages listed below, or by using the keyword search tool below to find specific information within the annual report.-
 1
1 -
2
-
3
-
4
-
5
-
6
-
7
-
8
-
9
-
10
-
11
-
12
-
13
-
14
-
15
-
16
-
17
-
18
-
19
-
20
-
21
-
22
-
23
-
24
-
25
-
26
-
27
-
28
-
29
-
30
-
31
-
32
-
33
-
34
-
35
-
36
-
37
-
38
-
39
-
40
-
41
-
42
-
43
-
44
-
45
-
46
-
47
-
48
-
49
-
50
-
51
-
52
-
53
-
54
-
55
-
56
-
57
-
58
-
 59
59 -
 60
60 -
 61
61 -
 62
62 -
 63
63 -
 64
64 -
 65
65 -
 66
66 -
 67
67 -
 68
68 -
 69
69 -
 70
70 -
 71
71 -
 72
72 -
 73
73 -
 74
74 -
 75
75 -
 76
76 -
 77
77 -
 78
78 -
 79
79 -
80
-
81
-
82
-
83
-
84
-
85
-
86
-
87
-
88
-
89
-
90
-
91
-
92
-
93
-
94
-
95
-
96
-
97
-
98
-
99
-
100
-
101
-
102
-
103
-
104
-
105
-
106
-
107
-
108
-
109
-
110
-
111
-
112
-
113
-
114
-
115
-
116
-
117
-
118
-
119
-
120
-
121
-
122
-
123
-
124
-
125
-
126
-
127
-
128
-
129
-
130
-
131
-
132
-
133
-
134
-
135
-
136
-
137
-
138
-
139
-
140
-
141
-
142
-
143
-
144
-
145
-
146
-
147
-
148
-
149
-
150
-
151
-
152
-
153
-
154
-
155
-
156
-
157
-
158
-
159
-
160
-
161
-
162
-
163
-
164
-
165
-
166
-
167
-
168
-
169
-
170
-
171
-
172
-
173
-
174
-
175
-
176
-
177
-
178
-
179
-
180
-
181
-
182
-
183
-
184
-
185
-
186
-
187
-
188
-
189
-
190
-
191
-
192
-
193
-
194
-
195
-
196
-
197
-
198
-
199
-
200
-
201
-
202
-
203
-
204
-
205
-
206
-
207
-
208
-
209
-
210
-
211
-
212
-
213
-
214
-
215
-
216
-
217
-
218
-
219
-
220
-
221
-
222
-
223
-
224
-
225
-
226
-
227
-
228
-
229
-
230
-
231
-
232
-
233
-
234
-
235
-
236
 |
 |

53
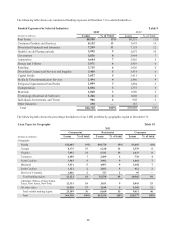
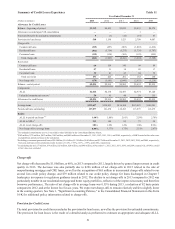
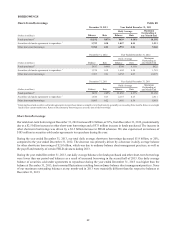
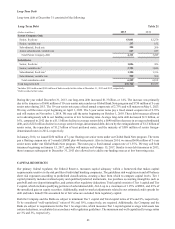
NONPERFORMING ASSETS
The following table presents our NPAs at December 31:
Table 13
(Dollars in millions) 2013 2012 2011 2010 2009
Nonaccrual/NPLs
Commercial loans:
C&I $196 $194 $348 $584 $732
CRE 39 66 288 342 191
Commercial construction 12 34 290 961 1,247
Total commercial NPLs 247 294 926 1,887 2,170
Residential loans:
Residential mortgages - nonguaranteed 441 775 1,392 1,543 2,283
Home equity products 210 341 338 355 367
Residential construction 61 112 220 290 529
Total residential NPLs 712 1,228 1,950 2,188 3,179
Consumer loans:
Other direct 56 7 10 8
Indirect 719 20 25 45
Total consumer NPLs 12 25 27 35 53
Total nonaccrual/NPLs 971 1,547 2,903 4,110 5,402
OREO1170 264 479 596 620
Other repossessed assets 79105279
Nonperforming LHFS 17 37———
Total NPAs $1,165 $1,857 $3,392 $4,758 $6,101
Accruing loans past due 90 days or more $1,228 $782 $2,028 $1,565 $1,500
Accruing LHFS past due 90 days or more —1322
TDRs
Accruing restructured loans $2,749 $2,501 $2,820 $2,613 $1,641
Nonaccruing restructured loans2391 639 802 1,005 913
Ratios
NPLs to total loans 0.76% 1.27% 2.37% 3.54% 4.75%
Nonperforming assets to total loans plus OREO,
other repossessed assets, and nonperforming LHFS 0.91 1.52 2.76 4.08 5.33
1 Does not include foreclosed real estate related to loans insured by the FHA or the VA. Proceeds due from the FHA and the VA are recorded as a receivable in other
assets until the funds are received and the property is conveyed. The receivable amount related to proceeds due from FHA or the VA totaled $88 million, $140
million, $132 million, $195 million, and $113 million at December 31, 2013, 2012, 2011, 2010, and 2009, respectively.
2 Nonaccruing restructured loans are included in total nonaccrual/NPLs.
NPAs decreased $692 million, or 37%, during 2013 compared to 2012. The decrease was primarily attributable to a $576
million, or 37%, decrease in NPLs, and a $94 million decline in OREO. All nonaccrual loan classes declined except C&I,
which remained relatively unchanged compared to 2012. Net charge-offs, foreclosures, and improved loan performance
contributed to the decrease in NPLs, as well as the return to accruing status of Chapter 7 bankruptcy loans. Specifically, the
decrease in NPLs was driven by reductions in residential mortgage NPLs of $334 million, or 43%, and home equity NPLs of
$131 million, or 38%. The decrease in residential mortgage NPLs was primarily due to the return to accruing TDR status of
approximately $219 million of Chapter 7 bankruptcy loans, which were current for at least six months following discharge
by the bankruptcy court. At December 31, 2013, our ratio of NPLs to total loans was 0.76%, down from 1.27% at December 31,
2012 as a result of the decline in NPLs and the increase in total loans. We expect further, but moderating, declines in NPLs
during 2014, led by continuing improvements in residential portfolios.
Real estate related loans comprise a significant portion of our overall NPAs as a result of the devaluation of U.S. housing
during the recent economic recession. The amount of time necessary to obtain control of residential real estate collateral in
certain states, primarily Florida, has remained elevated due to delays in the foreclosure process. These delays may continue
to impact the resolution of real estate related loans within the NPA portfolio.