SunTrust 2013 Annual Report Download - page 58
Download and view the complete annual report
Please find page 58 of the 2013 SunTrust annual report below. You can navigate through the pages in the report by either clicking on the pages listed below, or by using the keyword search tool below to find specific information within the annual report.-
 1
1 -
2
-
3
-
4
-
5
-
6
-
7
-
8
-
9
-
10
-
11
-
12
-
13
-
14
-
15
-
16
-
17
-
18
-
19
-
20
-
21
-
22
-
23
-
24
-
25
-
26
-
27
-
28
-
29
-
30
-
31
-
32
-
33
-
34
-
35
-
36
-
37
-
38
-
39
-
40
-
41
-
42
-
43
-
44
-
45
-
46
-
47
-
 48
48 -
 49
49 -
 50
50 -
 51
51 -
 52
52 -
 53
53 -
 54
54 -
 55
55 -
 56
56 -
 57
57 -
 58
58 -
 59
59 -
 60
60 -
 61
61 -
 62
62 -
 63
63 -
 64
64 -
 65
65 -
 66
66 -
 67
67 -
 68
68 -
69
-
70
-
71
-
72
-
73
-
74
-
75
-
76
-
77
-
78
-
79
-
80
-
81
-
82
-
83
-
84
-
85
-
86
-
87
-
88
-
89
-
90
-
91
-
92
-
93
-
94
-
95
-
96
-
97
-
98
-
99
-
100
-
101
-
102
-
103
-
104
-
105
-
106
-
107
-
108
-
109
-
110
-
111
-
112
-
113
-
114
-
115
-
116
-
117
-
118
-
119
-
120
-
121
-
122
-
123
-
124
-
125
-
126
-
127
-
128
-
129
-
130
-
131
-
132
-
133
-
134
-
135
-
136
-
137
-
138
-
139
-
140
-
141
-
142
-
143
-
144
-
145
-
146
-
147
-
148
-
149
-
150
-
151
-
152
-
153
-
154
-
155
-
156
-
157
-
158
-
159
-
160
-
161
-
162
-
163
-
164
-
165
-
166
-
167
-
168
-
169
-
170
-
171
-
172
-
173
-
174
-
175
-
176
-
177
-
178
-
179
-
180
-
181
-
182
-
183
-
184
-
185
-
186
-
187
-
188
-
189
-
190
-
191
-
192
-
193
-
194
-
195
-
196
-
197
-
198
-
199
-
200
-
201
-
202
-
203
-
204
-
205
-
206
-
207
-
208
-
209
-
210
-
211
-
212
-
213
-
214
-
215
-
216
-
217
-
218
-
219
-
220
-
221
-
222
-
223
-
224
-
225
-
226
-
227
-
228
-
229
-
230
-
231
-
232
-
233
-
234
-
235
-
236
 |
 |
42
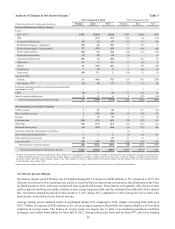
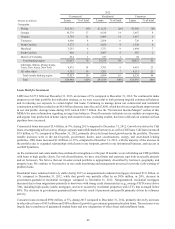
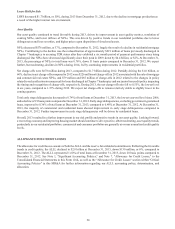
$600 million of 3-year fixed rate senior notes under our Global Bank Note program. The notes pay a floating coupon rate of
3-month LIBOR plus 44 basis points and a fixed annual coupon rate of 1.35%, respectively.
The decrease of 19 basis points on rates paid on interest-bearing liabilities during 2013 compared to 2012 was primarily due
to a 41 basis point decline in rates paid on long-term debt, driven by the aforementioned redemption and extinguishments,
and a 15 basis point decline in rates paid on total interest bearing deposits, which included a 13 basis point decrease in rates
paid on consumer and commercial deposits. The decline in the overall average rate paid on consumer and commercial deposits
was a result of the improved funding mix driven by the shift from higher cost deposit products to lower cost deposit products,
as well as a decline in market interest rates.
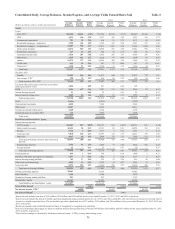
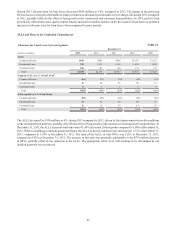
During 2013, the interest rate environment was characterized by a steepening in the yield curve compared to 2012, as rates
at the long end of the yield curve increased. More specifically, for the year ended December 31, 2013, benchmark rates were
as follows compared to the same period in 2012: one-month LIBOR averaged 0.19%, a decrease of 5 basis points, three-
month LIBOR averaged 0.27%, a decrease of 16 basis points, five-year swaps averaged 1.32%, an increase of 34 basis points,
and ten-year swaps averaged 2.47%, an increase of 59 basis points. During 2013, the Fed funds target rate averaged 0.25%
and the Prime rate averaged 3.25%, both unchanged from 2012.
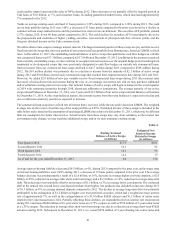
Looking forward, we expect the net interest margin to decline during 2014 compared to 2013, albeit at a slower pace relative
to the decline we experienced this year. The drivers of this decline will be further compression in loan yields due to the
continued low short-term interest rate environment, partially offset by the benefits of a steeper yield curve. Specifically, the
steeper curve is beneficial to spread income and the positive benefit should be noticed in our results over time as existing
loans and securities provide cash flows that we can redeploy at higher yields. Additionally, assuming loan growth continues,
we anticipate improvements to net interest income during 2014 compared to 2013.
Foregone Interest
Foregone interest income from NPLs reduced the net interest margin by 3 basis points during 2013, compared to a reduction
of 8 basis points during 2012, as average nonaccrual loans decreased by $1.1 billion during the year ended December 31,
2013. See additional discussion of our expectations of future credit quality in the “Loans,” “Allowance for Credit Losses,”
and “Nonperforming Assets” sections of this MD&A. Tables 2 and 3 contain more detailed information concerning average
balances, yields earned, and rates paid.
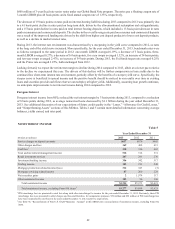
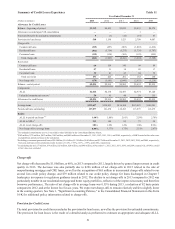
NONINTEREST INCOME
Table 5
Year Ended December 31
(Dollars in millions) 2013 2012 2011
Service charges on deposit accounts $657 $676 $685
Other charges and fees 369 402 415
Card fees 1310 316 463
Trust and investment management income 518 512 531
Retail investment services 267 241 230
Investment banking income 356 342 317
Trading income 182 211 248
Mortgage production related income/(loss) 314 343 (5)
Mortgage servicing related income 87 260 224
Net securities gains 21,974 117
Other noninterest income 152 96 196
Total noninterest income $3,214 $5,373 $3,421
Total noninterest income, excluding Form 8-K items 2$3,277 $3,898 $3,421
1 PIN interchange fees are presented in card fees along with other interchange fee income for the year ended December 31, 2013. Previously, these PIN
interchange fees were presented in other charges and fees and therefore, for comparative purposes, $76 million and $92 million of PIN interchange fees
have been reclassified to card fees for the years ended December 31, 2012 and 2011, respectively.
2 See Table 36, "Reconcilement of Non-U.S. GAAP Measures - Annual," in this MD&A for a reconciliation of noninterest income, excluding Form 8-K
items.