SunTrust 2013 Annual Report Download - page 122
Download and view the complete annual report
Please find page 122 of the 2013 SunTrust annual report below. You can navigate through the pages in the report by either clicking on the pages listed below, or by using the keyword search tool below to find specific information within the annual report.-
 1
1 -
2
-
3
-
4
-
5
-
6
-
7
-
8
-
9
-
10
-
11
-
12
-
13
-
14
-
15
-
16
-
17
-
18
-
19
-
20
-
21
-
22
-
23
-
24
-
25
-
26
-
27
-
28
-
29
-
30
-
31
-
32
-
33
-
34
-
35
-
36
-
37
-
38
-
39
-
40
-
41
-
42
-
43
-
44
-
45
-
46
-
47
-
48
-
49
-
50
-
51
-
52
-
53
-
54
-
55
-
56
-
57
-
58
-
59
-
60
-
61
-
62
-
63
-
64
-
65
-
66
-
67
-
68
-
69
-
70
-
71
-
72
-
73
-
74
-
75
-
76
-
77
-
78
-
79
-
80
-
81
-
82
-
83
-
84
-
85
-
86
-
87
-
88
-
89
-
90
-
91
-
92
-
93
-
94
-
95
-
96
-
97
-
98
-
99
-
100
-
101
-
102
-
103
-
104
-
105
-
106
-
107
-
108
-
109
-
110
-
111
-
 112
112 -
 113
113 -
 114
114 -
 115
115 -
 116
116 -
 117
117 -
 118
118 -
 119
119 -
 120
120 -
 121
121 -
 122
122 -
 123
123 -
 124
124 -
 125
125 -
 126
126 -
 127
127 -
 128
128 -
 129
129 -
 130
130 -
 131
131 -
 132
132 -
133
-
134
-
135
-
136
-
137
-
138
-
139
-
140
-
141
-
142
-
143
-
144
-
145
-
146
-
147
-
148
-
149
-
150
-
151
-
152
-
153
-
154
-
155
-
156
-
157
-
158
-
159
-
160
-
161
-
162
-
163
-
164
-
165
-
166
-
167
-
168
-
169
-
170
-
171
-
172
-
173
-
174
-
175
-
176
-
177
-
178
-
179
-
180
-
181
-
182
-
183
-
184
-
185
-
186
-
187
-
188
-
189
-
190
-
191
-
192
-
193
-
194
-
195
-
196
-
197
-
198
-
199
-
200
-
201
-
202
-
203
-
204
-
205
-
206
-
207
-
208
-
209
-
210
-
211
-
212
-
213
-
214
-
215
-
216
-
217
-
218
-
219
-
220
-
221
-
222
-
223
-
224
-
225
-
226
-
227
-
228
-
229
-
230
-
231
-
232
-
233
-
234
-
235
-
236
 |
 |

106
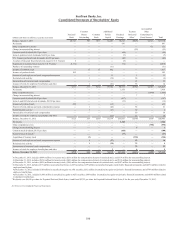
SunTrust Banks, Inc.
Consolidated Statements of Shareholders’ Equity
(Dollars and shares in millions, except per share data)
Preferred
Stock
Common
Shares
Outstanding
Common
Stock
Additional
Paid in
Capital
Retained
Earnings
Treasury
Stock and
Other 1
Accumulated
Other
Comprehensive
(Loss)/Income 2Total
Balance, January 1, 2011 $4,942 500 $515 $8,403 $8,542 ($888) $1,616 $23,130
Net income — — — — 647 — — 647
Other comprehensive income — — — — — — 133 133
Change in noncontrolling interest — — — — — (22) — (22)
Common stock dividends, $0.12 per share — — — — (64) — — (64)
Series A preferred stock dividends, $4,056 per share — — — — (7)— — (7)
U.S. Treasury preferred stock dividends, $1,236 per share — — — — (60) — — (60)
Accretion of discount for preferred stock issued to U.S. Treasury 6 — — — (6)— ——
Repurchase of preferred stock issued to U.S. Treasury (4,776) — — — (74) — — (4,850)
Purchase of outstanding warrants (11) (11)
Issuance of common stock — 35 35 982 — — — 1,017
Issuance of preferred stock 103 — — — — — — 103
Exercise of stock options and stock compensation expense — — — 11 — 1 — 12
Restricted stock activity — 1 — (58)— 50 — (8)
Amortization of restricted stock compensation — — — — — 32 — 32
Issuance of stock for employee benefit plans and other — 1 — (21) — 35 — 14
Balance, December 31, 2011 $275 537 $550 $9,306 $8,978 ($792) $1,749 $20,066
Net income — — — — 1,958 — — 1,958
Other comprehensive loss — — — — — — (1,440) (1,440)
Change in noncontrolling interest — — — — — 7 — 7
Common stock dividends, $0.20 per share — — — — (107) — — (107)
Series A and B Preferred stock dividends, $4,052 per share — — — — (12) — — (12)
Issuance of preferred stock 450 — — (12) — — — 438
Exercise of stock options and stock compensation expense — 1 — (44) — 65 — 21
Restricted stock activity — 1 — (63)— 69 — 6
Amortization of restricted stock compensation — — — — — 30 — 30
Issuance of stock for employee benefit plans and other — — — (13) — 31 — 18
Balance, December 31, 2012 $725 539 $550 $9,174 $10,817 ($590) $309 $20,985
Net income — — — — 1,344 — — 1,344
Other comprehensive loss — — — — — — (598) (598)
Change in noncontrolling interest —————5 —5
Common stock dividends, $0.35 per share ————
(188) — — (188)
Preferred stock dividends 3————
(37) — — (37)
Acquisition of treasury stock —(5)— — — (150) — (150)
Exercise of stock options and stock compensation expense —1—
(27) — 43 — 16
Restricted stock activity —1—
(35)— 39 — 4
Amortization of restricted stock compensation —————32 —32
Issuance of stock for employee benefit plans and other ———3—6 —9
Balance, December 31, 2013 $725 536 $550 $9,115 $11,936 ($615)($289) $21,422
1 At December 31, 2013, includes ($684) million for treasury stock, ($50) million for compensation element of restricted stock, and $119 million for noncontrolling interest.
At December 31, 2012, includes ($656) million for treasury stock, ($48) million for compensation element of restricted stock, and $114 million for noncontrolling interest.
At December 31, 2011, includes ($851) million for treasury stock, ($48) million for compensation element of restricted stock, and $107 million for noncontrolling interest.
2 At December 31, 2013, includes ($77) million in unrealized net losses on AFS securities, $279 million in unrealized net gains on derivative financial instruments, and ($491) million related to
employee benefit plans.
At December 31, 2012, includes $520 million in unrealized net gains on AFS securities, $532 million in unrealized net gains on derivative financial instruments, and ($743) million related to
employee benefit plans.
At December 31, 2011, includes $1,863 million in unrealized net gains on AFS securities, $569 million in unrealized net gains on derivative financial instruments, and ($683) million related
to employee benefit plans.
3 Dividends were $4,056 per share for Perpetual Preferred Stock Series A and B and $5,793 per share for Perpetual Preferred Stock Series E for the year ended December 31, 2013.
See Notes to Consolidated Financial Statements.