SunTrust 2013 Annual Report Download - page 141
Download and view the complete annual report
Please find page 141 of the 2013 SunTrust annual report below. You can navigate through the pages in the report by either clicking on the pages listed below, or by using the keyword search tool below to find specific information within the annual report.-
 1
1 -
2
-
3
-
4
-
5
-
6
-
7
-
8
-
9
-
10
-
11
-
12
-
13
-
14
-
15
-
16
-
17
-
18
-
19
-
20
-
21
-
22
-
23
-
24
-
25
-
26
-
27
-
28
-
29
-
30
-
31
-
32
-
33
-
34
-
35
-
36
-
37
-
38
-
39
-
40
-
41
-
42
-
43
-
44
-
45
-
46
-
47
-
48
-
49
-
50
-
51
-
52
-
53
-
54
-
55
-
56
-
57
-
58
-
59
-
60
-
61
-
62
-
63
-
64
-
65
-
66
-
67
-
68
-
69
-
70
-
71
-
72
-
73
-
74
-
75
-
76
-
77
-
78
-
79
-
80
-
81
-
82
-
83
-
84
-
85
-
86
-
87
-
88
-
89
-
90
-
91
-
92
-
93
-
94
-
95
-
96
-
97
-
98
-
99
-
100
-
101
-
102
-
103
-
104
-
105
-
106
-
107
-
108
-
109
-
110
-
111
-
112
-
113
-
114
-
115
-
116
-
117
-
118
-
119
-
120
-
121
-
122
-
123
-
124
-
125
-
126
-
127
-
128
-
129
-
130
-
 131
131 -
 132
132 -
 133
133 -
 134
134 -
 135
135 -
 136
136 -
 137
137 -
 138
138 -
 139
139 -
 140
140 -
 141
141 -
 142
142 -
 143
143 -
 144
144 -
 145
145 -
 146
146 -
 147
147 -
 148
148 -
 149
149 -
 150
150 -
 151
151 -
152
-
153
-
154
-
155
-
156
-
157
-
158
-
159
-
160
-
161
-
162
-
163
-
164
-
165
-
166
-
167
-
168
-
169
-
170
-
171
-
172
-
173
-
174
-
175
-
176
-
177
-
178
-
179
-
180
-
181
-
182
-
183
-
184
-
185
-
186
-
187
-
188
-
189
-
190
-
191
-
192
-
193
-
194
-
195
-
196
-
197
-
198
-
199
-
200
-
201
-
202
-
203
-
204
-
205
-
206
-
207
-
208
-
209
-
210
-
211
-
212
-
213
-
214
-
215
-
216
-
217
-
218
-
219
-
220
-
221
-
222
-
223
-
224
-
225
-
226
-
227
-
228
-
229
-
230
-
231
-
232
-
233
-
234
-
235
-
236
 |
 |

Notes to Consolidated Financial Statements, continued
125
Risk ratings are refreshed at least annually, or more frequently as appropriate, based upon considerations such as market conditions,
loan characteristics, and portfolio trends. Additionally, management routinely reviews portfolio risk ratings, trends, and
concentrations to support risk identification and mitigation activities.
For consumer and residential loans, the Company monitors credit risk based on indicators such as delinquencies and FICO scores.
The Company believes that consumer credit risk, as assessed by the industry-wide FICO scoring method, is a relevant credit
quality indicator. Borrower-specific FICO scores are obtained at origination as part of the Company’s formal underwriting process,
and refreshed FICO scores are obtained by the Company at least quarterly.
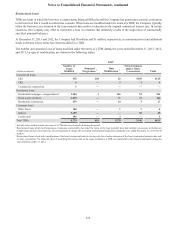
For government-guaranteed loans, the Company monitors the credit quality based primarily on delinquency status, as it is a more
relevant indicator of credit quality due to the government guarantee. At December 31, 2013 and 2012, 81% and 89%, respectively,
of the guaranteed student loan portfolio was current with respect to payments. At December 31, 2013 and 2012, 82% and 83%,
respectively, of the guaranteed residential loan portfolio was current with respect to payments. Loss exposure to the Company
on these loans is mitigated by the government guarantee.
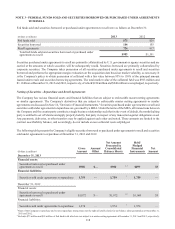
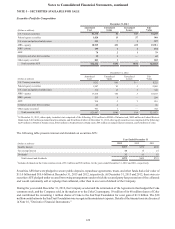
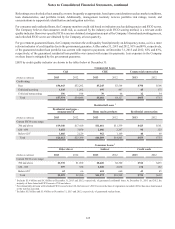
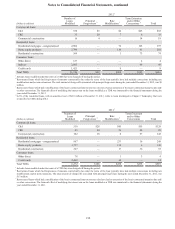
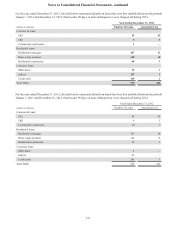
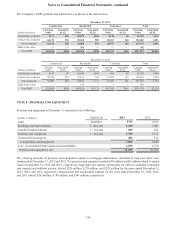
LHFI by credit quality indicator are shown in the tables below at December 31:
Commercial Loans
C&I CRE Commercial construction
(Dollars in millions) 2013 2012 2013 2012 2013 2012
Credit rating:
Pass $56,443 $52,292 $5,245 $3,564 $798 $506
Criticized accruing 1,335 1,562 197 497 45 173
Criticized nonaccruing 196 194 39 66 12 34
Total $57,974 $54,048 $5,481 $4,127 $855 $713
Residential Loans 1
Residential mortgages -
nonguaranteed Home equity products Residential construction
(Dollars in millions) 2013 2012 2013 2012 2013 2012
Current FICO score range:
700 and above $19,100 $17,410 $11,661 $11,339 $423 $561
620 - 699 3,652 3,850 2,186 2,297 90 123
Below 62021,660 2,129 962 1,169 40 69
Total $24,412 $23,389 $14,809 $14,805 $553 $753
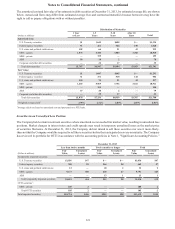
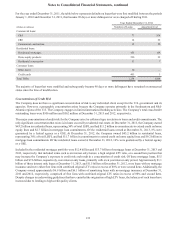
Consumer Loans 3
Other direct Indirect Credit cards
(Dollars in millions) 2013 2012 2013 2012 2013 2012
Current FICO score range:
700 and above $2,370 $1,980 $8,420 $8,300 $512 $435
620 - 699 397 350 2,228 2,038 176 152
Below 620262 66 624 660 43 45
Total $2,829 $2,396 $11,272 $10,998 $731 $632
1 Excludes $3.4 billion and $4.3 billion at December 31, 2013 and 2012, respectively, of guaranteed residential loans. At December 31, 2013 and 2012, the
majority of these loans had FICO scores of 700 and above.
2 For substantially all loans with refreshed FICO scores below 620, the borrower’s FICO score at the time of origination exceeded 620 but has since deteriorated
as the loan has seasoned.
3 Excludes $5.5 billion and $5.4 billion at December 31, 2013 and 2012, respectively, of guaranteed student loans.