SunTrust 2013 Annual Report Download - page 76
Download and view the complete annual report
Please find page 76 of the 2013 SunTrust annual report below. You can navigate through the pages in the report by either clicking on the pages listed below, or by using the keyword search tool below to find specific information within the annual report.-
 1
1 -
2
-
3
-
4
-
5
-
6
-
7
-
8
-
9
-
10
-
11
-
12
-
13
-
14
-
15
-
16
-
17
-
18
-
19
-
20
-
21
-
22
-
23
-
24
-
25
-
26
-
27
-
28
-
29
-
30
-
31
-
32
-
33
-
34
-
35
-
36
-
37
-
38
-
39
-
40
-
41
-
42
-
43
-
44
-
45
-
46
-
47
-
48
-
49
-
50
-
51
-
52
-
53
-
54
-
55
-
56
-
57
-
58
-
59
-
60
-
61
-
62
-
63
-
64
-
65
-
 66
66 -
 67
67 -
 68
68 -
 69
69 -
 70
70 -
 71
71 -
 72
72 -
 73
73 -
 74
74 -
 75
75 -
 76
76 -
 77
77 -
 78
78 -
 79
79 -
 80
80 -
 81
81 -
 82
82 -
 83
83 -
 84
84 -
 85
85 -
 86
86 -
87
-
88
-
89
-
90
-
91
-
92
-
93
-
94
-
95
-
96
-
97
-
98
-
99
-
100
-
101
-
102
-
103
-
104
-
105
-
106
-
107
-
108
-
109
-
110
-
111
-
112
-
113
-
114
-
115
-
116
-
117
-
118
-
119
-
120
-
121
-
122
-
123
-
124
-
125
-
126
-
127
-
128
-
129
-
130
-
131
-
132
-
133
-
134
-
135
-
136
-
137
-
138
-
139
-
140
-
141
-
142
-
143
-
144
-
145
-
146
-
147
-
148
-
149
-
150
-
151
-
152
-
153
-
154
-
155
-
156
-
157
-
158
-
159
-
160
-
161
-
162
-
163
-
164
-
165
-
166
-
167
-
168
-
169
-
170
-
171
-
172
-
173
-
174
-
175
-
176
-
177
-
178
-
179
-
180
-
181
-
182
-
183
-
184
-
185
-
186
-
187
-
188
-
189
-
190
-
191
-
192
-
193
-
194
-
195
-
196
-
197
-
198
-
199
-
200
-
201
-
202
-
203
-
204
-
205
-
206
-
207
-
208
-
209
-
210
-
211
-
212
-
213
-
214
-
215
-
216
-
217
-
218
-
219
-
220
-
221
-
222
-
223
-
224
-
225
-
226
-
227
-
228
-
229
-
230
-
231
-
232
-
233
-
234
-
235
-
236
 |
 |
60
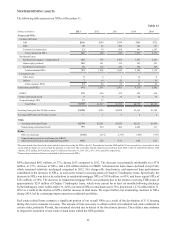
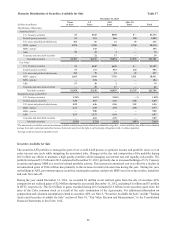
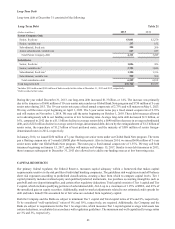
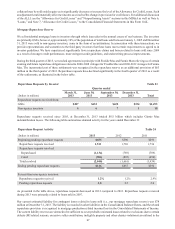
For the year ended December 31, 2013, the average yield, on a FTE basis, for the securities AFS portfolio was 2.57%, compared
with 2.97% for the year ended December 31, 2012. Prepayments and maturities of higher yielding securities, reinvestment
of principal cash flow at lower yields, and the foregone dividend income on the Coke common stock drove the decline in
yield on securities AFS. Our total investment securities portfolio had an effective duration of 4.7 years at December 31, 2013
compared to 2.2 years at December 31, 2012. The increase in the effective duration is a result of cash flow reinvestment
activities and slower agency MBS prepayment assumptions associated with higher mortgage rates during the year ended
December 31, 2013. Effective duration is a measure of price sensitivity of a bond portfolio to an immediate change in market
interest rates, taking into consideration embedded options. An effective duration of 4.7 years suggests an expected price change
of 4.7% for a one percent instantaneous change in market interest rates.
The credit quality and liquidity profile of the securities portfolio remained strong at December 31, 2013, and consequently,
we have the flexibility to respond to changes in the economic environment and take actions as opportunities arise to manage
our interest rate risk profile and balance liquidity against investment returns. Over the longer term, the size and composition
of the investment portfolio will reflect balance sheet trends, our overall liquidity, and interest rate risk management objectives.
Accordingly, the size and composition of the investment portfolio could change meaningfully over time.
Federal Home Loan Bank and Federal Reserve Bank Stock
We hold capital stock in the FHLB of Atlanta and in the Federal Reserve Bank. In order to be an FHLB member, we are
required to purchase capital stock in the FHLB. In exchange, members take advantage of competitively priced advances as
a wholesale funding source and access grants and low-cost loans for affordable housing and community-development projects,
amongst other benefits. At December 31, 2013, we held a total of $336 million of capital stock in the FHLB, an increase of
$107 million compared to December 31, 2012. In order to become a member of the Federal Reserve System, regulations
require that we hold a certain amount of capital stock as either a percentage of the Bank’s capital or as a percentage of total
deposit liabilities. At December 31, 2013, we held $402 million of Federal Reserve Bank stock, unchanged from December
31, 2012.
Investment in Coke
Prior to September 2012, we owned common shares of Coke since 1919. These shares grew in value and were classified as
securities AFS with unrealized gains, net of tax, recorded as a component of shareholders' equity. Because of the low accounting
cost basis of these shares, we accumulated significant unrealized gains in shareholders' equity. In 2008, we entered into two
Agreements with an unaffiliated third party to deliver to the counterparty either a variable number of our shares in Coke or
an equivalent amount of cash in lieu of such shares on the 2014 and 2015 settlement dates. In 2012, we reevaluated our Coke
holdings in light of the regulatory proposal regarding Basel III, which, as proposed at that time, would have increased the
RWA of equity holdings and would have introduced potential volatility to our regulatory capital ratios via fluctuations in
AOCI, and the negative implications associated with equity securities in assumed adverse economic scenarios within future
CCAR assessments. Following this review, we and the counterparty accelerated the termination of the Agreements. In
September 2012, we divested our ownership of Coke shares through sales in the market, sales to the counterparty under the
Agreements, and a charitable contribution of shares. As a result of the Coke stock sales, charitable contribution, and termination
of the Agreements, we recorded a pre-tax gain of approximately $1.9 billion during the year ended December 31, 2012. The
execution and termination of the Agreements is discussed further in Note 16, "Derivative Financial Instruments," to the
Consolidated Financial Statements in this Form 10-K.