SunTrust 2013 Annual Report Download - page 113
Download and view the complete annual report
Please find page 113 of the 2013 SunTrust annual report below. You can navigate through the pages in the report by either clicking on the pages listed below, or by using the keyword search tool below to find specific information within the annual report.-
 1
1 -
2
-
3
-
4
-
5
-
6
-
7
-
8
-
9
-
10
-
11
-
12
-
13
-
14
-
15
-
16
-
17
-
18
-
19
-
20
-
21
-
22
-
23
-
24
-
25
-
26
-
27
-
28
-
29
-
30
-
31
-
32
-
33
-
34
-
35
-
36
-
37
-
38
-
39
-
40
-
41
-
42
-
43
-
44
-
45
-
46
-
47
-
48
-
49
-
50
-
51
-
52
-
53
-
54
-
55
-
56
-
57
-
58
-
59
-
60
-
61
-
62
-
63
-
64
-
65
-
66
-
67
-
68
-
69
-
70
-
71
-
72
-
73
-
74
-
75
-
76
-
77
-
78
-
79
-
80
-
81
-
82
-
83
-
84
-
85
-
86
-
87
-
88
-
89
-
90
-
91
-
92
-
93
-
94
-
95
-
96
-
97
-
98
-
99
-
100
-
101
-
102
-
 103
103 -
 104
104 -
 105
105 -
 106
106 -
 107
107 -
 108
108 -
 109
109 -
 110
110 -
 111
111 -
 112
112 -
 113
113 -
 114
114 -
 115
115 -
 116
116 -
 117
117 -
 118
118 -
 119
119 -
 120
120 -
 121
121 -
 122
122 -
 123
123 -
124
-
125
-
126
-
127
-
128
-
129
-
130
-
131
-
132
-
133
-
134
-
135
-
136
-
137
-
138
-
139
-
140
-
141
-
142
-
143
-
144
-
145
-
146
-
147
-
148
-
149
-
150
-
151
-
152
-
153
-
154
-
155
-
156
-
157
-
158
-
159
-
160
-
161
-
162
-
163
-
164
-
165
-
166
-
167
-
168
-
169
-
170
-
171
-
172
-
173
-
174
-
175
-
176
-
177
-
178
-
179
-
180
-
181
-
182
-
183
-
184
-
185
-
186
-
187
-
188
-
189
-
190
-
191
-
192
-
193
-
194
-
195
-
196
-
197
-
198
-
199
-
200
-
201
-
202
-
203
-
204
-
205
-
206
-
207
-
208
-
209
-
210
-
211
-
212
-
213
-
214
-
215
-
216
-
217
-
218
-
219
-
220
-
221
-
222
-
223
-
224
-
225
-
226
-
227
-
228
-
229
-
230
-
231
-
232
-
233
-
234
-
235
-
236
 |
 |

97
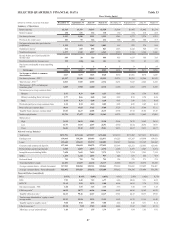
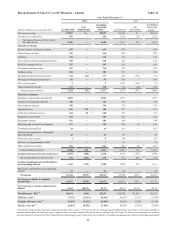
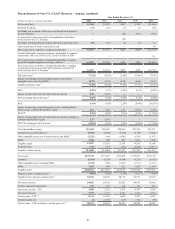
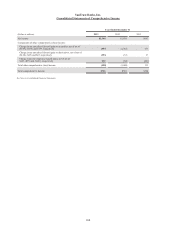
Reconcilement of Non-U.S. GAAP Measures – Annual, continued
Year Ended December 31
(Dollars in millions, except per share data) 2013 2012 2011 2010 2009
Net income/(loss) $1,344 $1,958 $647 $189 ($1,564)
Preferred dividends (37) (12) (7) (7) (14)
Dividends and accretion of discount on preferred stock issued to
the U.S. Treasury —— (66) (267) (266)
Accelerated accretion associated with repurchase of preferred
stock issued to the U.S. Treasury —— (74) — —
Dividends and undistributed earnings allocated to unvested shares (10) (15) (5) (2) 17
Gain on purchase of Series A preferred stock ————94
Net income/(loss) available to common shareholders $1,297 $1,931 $495 ($87) ($1,733)
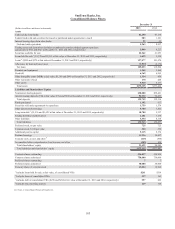
Goodwill/intangible impairment charges attributable to common
shareholders, after tax of $0 in 2012, and $36 million in 2009 —7 — — 715
Net income/(loss) available to common shareholders excluding
goodwill/intangible impairment charges, after tax 1$1,297 $1,938 $495 ($87) ($1,018)
Net income/(loss) available to common shareholders excluding
accelerated accretion associated with repurchase of preferred
stock issued to the U.S. Treasury 1$1,297 $1,931 $569 ($87) ($1,733)
Efficiency ratio 271.75% 59.67% 72.49% 67.94 % 79.07 %
Impact of excluding impairment/amortization of goodwill/
intangible assets other than MSRs (0.27) (0.43) (0.50) (0.58) (9.72)
Tangible efficiency ratio 371.48% 59.24% 71.99% 67.36 % 69.35 %
ROA 0.78% 1.11% 0.38% 0.11% (0.89%)
Impact of removing Form 8-K items from net income 0.10 (0.43) — — —
ROA excluding Form 8-K items 40.88% 0.68% 0.38% 0.11% (0.89%)
ROE 6.34% 9.56% 2.56% (0.49%) (10.07%)
Impact of removing average intangible assets, excluding MSRs,
from average common shareholders' equity 2.91 4.46 1.27 (0.27) (7.49)
ROTCE 59.25% 14.02% 3.83% (0.76%) (17.56%)
Impact of removing Form 8-K items from net income available to
common shareholders' equity 1.27 (5.47) — — —
ROTCE excluding Form 8-K items 510.52% 8.55% 3.83% (0.76%) (17.56%)
Total shareholders’ equity $21,422 $20,985 $20,066 $23,130 $22,531
Goodwill, net of deferred taxes 6(6,183) (6,206) (6,190) (6,189) (6,204)
Other intangible assets, net of deferred taxes, and MSRs 7(1,332) (949) (1,001) (1,545) (1,671)
MSRs 1,300 899 921 1,439 1,540
Tangible equity 15,207 14,729 13,796 16,835 16,196
Preferred stock (725) (725) (275) (4,942) (4,917)
Tangible common equity $14,482 $14,004 $13,521 $11,893 $11,279
Total assets $175,335 $173,442 $176,859 $172,874 $174,165
Goodwill (6,369) (6,369) (6,344) (6,323) (6,319)
Other intangible assets including MSRs (1,334) (956) (1,017) (1,571) (1,711)
MSRs 1,300 899 921 1,439 1,540
Tangible assets $168,932 $167,016 $170,419 $166,419 $167,675
Tangible equity to tangible assets 89.00% 8.82% 8.10% 10.12 % 9.66 %
Tangible book value per common share 9$27.01 $25.98 $25.18 $23.76 $22.59
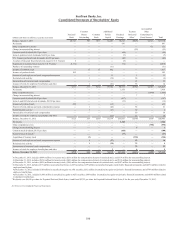
Net interest income $4,853 $5,102 $5,065 $4,854 $4,466
Taxable-equivalent adjustment 127 123 114 116 123
Net interest income - FTE 4,980 5,225 5,179 4,970 4,589
Noninterest income 3,214 5,373 3,421 3,729 3,710
Total revenue - FTE 10 8,194 10,598 8,600 8,699 8,299
Securities gains, net (2) (1,974) (117) (191) (98)
Total revenue - FTE excluding securities gains, net 10 $8,192 $8,624 $8,483 $8,508 $8,201