SunTrust 2013 Annual Report Download - page 171
Download and view the complete annual report
Please find page 171 of the 2013 SunTrust annual report below. You can navigate through the pages in the report by either clicking on the pages listed below, or by using the keyword search tool below to find specific information within the annual report.-
 1
1 -
2
-
3
-
4
-
5
-
6
-
7
-
8
-
9
-
10
-
11
-
12
-
13
-
14
-
15
-
16
-
17
-
18
-
19
-
20
-
21
-
22
-
23
-
24
-
25
-
26
-
27
-
28
-
29
-
30
-
31
-
32
-
33
-
34
-
35
-
36
-
37
-
38
-
39
-
40
-
41
-
42
-
43
-
44
-
45
-
46
-
47
-
48
-
49
-
50
-
51
-
52
-
53
-
54
-
55
-
56
-
57
-
58
-
59
-
60
-
61
-
62
-
63
-
64
-
65
-
66
-
67
-
68
-
69
-
70
-
71
-
72
-
73
-
74
-
75
-
76
-
77
-
78
-
79
-
80
-
81
-
82
-
83
-
84
-
85
-
86
-
87
-
88
-
89
-
90
-
91
-
92
-
93
-
94
-
95
-
96
-
97
-
98
-
99
-
100
-
101
-
102
-
103
-
104
-
105
-
106
-
107
-
108
-
109
-
110
-
111
-
112
-
113
-
114
-
115
-
116
-
117
-
118
-
119
-
120
-
121
-
122
-
123
-
124
-
125
-
126
-
127
-
128
-
129
-
130
-
131
-
132
-
133
-
134
-
135
-
136
-
137
-
138
-
139
-
140
-
141
-
142
-
143
-
144
-
145
-
146
-
147
-
148
-
149
-
150
-
151
-
152
-
153
-
154
-
155
-
156
-
157
-
158
-
159
-
160
-
 161
161 -
 162
162 -
 163
163 -
 164
164 -
 165
165 -
 166
166 -
 167
167 -
 168
168 -
 169
169 -
 170
170 -
 171
171 -
 172
172 -
 173
173 -
 174
174 -
 175
175 -
 176
176 -
 177
177 -
 178
178 -
 179
179 -
 180
180 -
 181
181 -
182
-
183
-
184
-
185
-
186
-
187
-
188
-
189
-
190
-
191
-
192
-
193
-
194
-
195
-
196
-
197
-
198
-
199
-
200
-
201
-
202
-
203
-
204
-
205
-
206
-
207
-
208
-
209
-
210
-
211
-
212
-
213
-
214
-
215
-
216
-
217
-
218
-
219
-
220
-
221
-
222
-
223
-
224
-
225
-
226
-
227
-
228
-
229
-
230
-
231
-
232
-
233
-
234
-
235
-
236
 |
 |
Notes to Consolidated Financial Statements, continued
155
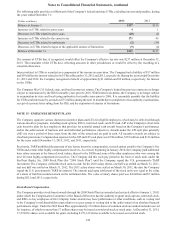
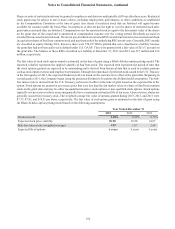
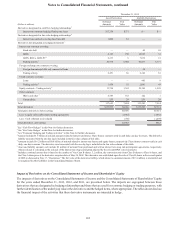
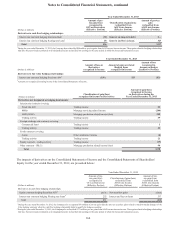
The changes in plan assets during the year ended December 31 were as follows:
Pension Benefits Other Postretirement Benefits
(Dollars in millions) 2013 2012 2013 2012
Fair value of plan assets, beginning of year $2,742 $2,550 $164 $161
Actual return on plan assets 304 350 14 17
Employer contributions 826 ——
Plan participants’ contributions ——21 22
Benefits paid (181) (184)(41)(36)
Fair value of plan assets, end of year $2,873 $2,742 $158 $164
Employer contributions indicated under pension benefits represent the benefits that were paid to nonqualified plan participants.
SERPs are not funded through plan assets.
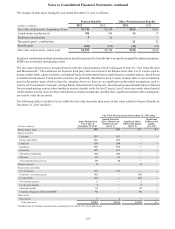
The fair value of plan assets is measured based on the fair value hierarchy which is discussed in Note 18, “Fair Value Election
and Measurement.” The valuations are based on third party data received as of the balance sheet date. Level 1 assets such as
money market funds, equity securities, and mutual funds are instruments that are traded in active markets and are valued based
on identical instruments. Fixed income securities are primarily classified as level 2 assets because there is not an identical
asset in the market upon which to base the valuation; however, there are no significant unobservable assumptions used to
value level 2 instruments. Corporate, foreign bonds, and preferred securities are valued based on quoted market prices obtained
from external pricing sources where trading in an active market exists for level 2 assets. Level 3 assets are assets where limited
visible market activity exists for these instruments or similar instruments, and therefore, significant unobservable assumptions
are used to value the securities.
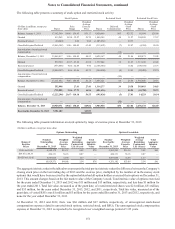
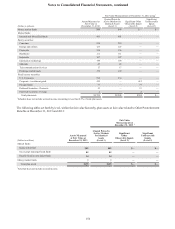
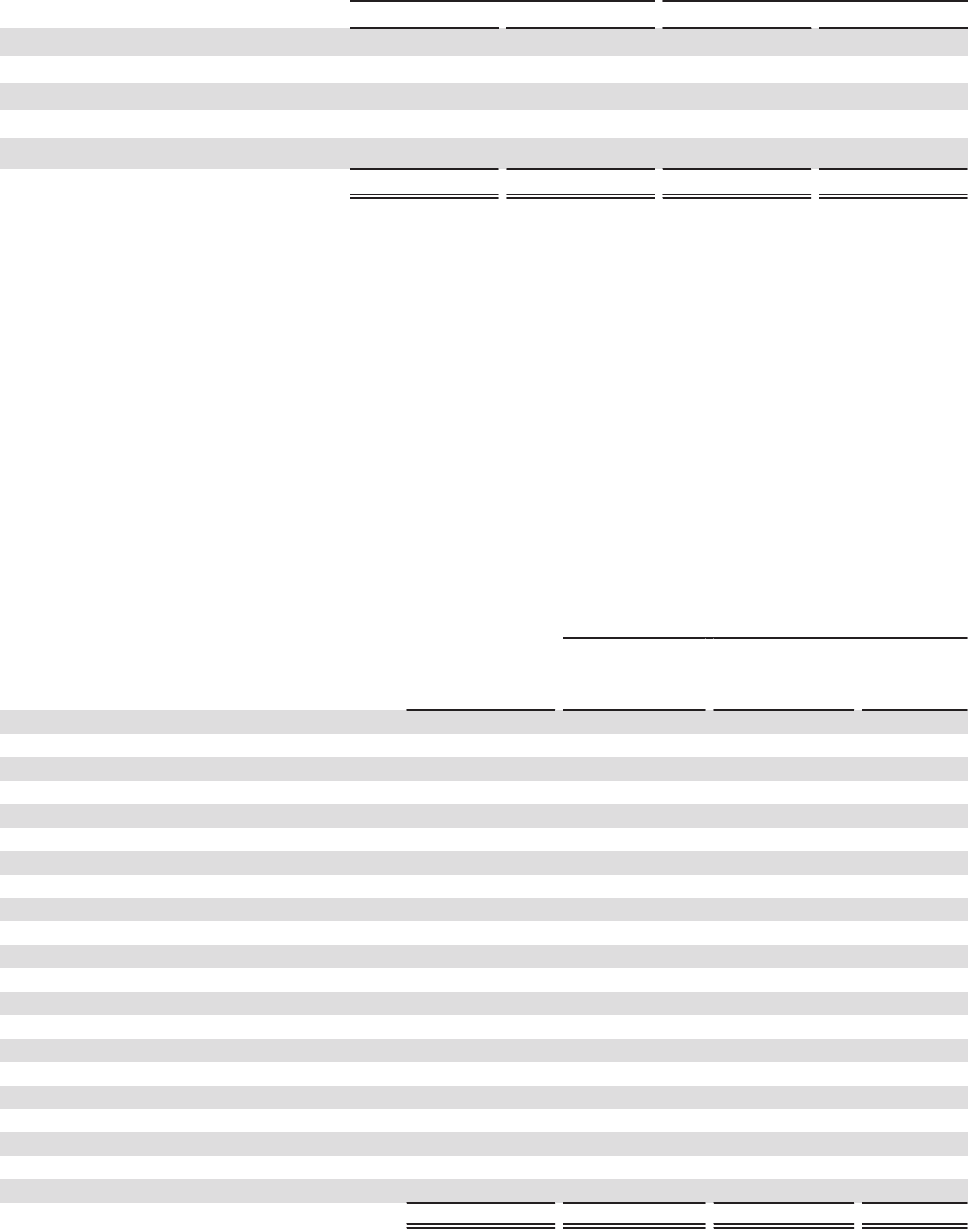
The following tables set forth by level, within the fair value hierarchy, plan assets at fair value related to Pension Benefits at
December 31, 2013 and 2012:
Fair Value Measurements at December 31, 2013 using 1
(Dollars in millions)
Assets Measured at
Fair Value at
December 31, 2013
Quoted Prices In
Active Markets for
Identical Assets
(Level 1)
Significant Other
Observable Inputs
(Level 2)
Significant
Unobservable
Inputs
(Level 3)
Money market funds $83 $83 $— $—
Equity securities:
Consumer 297 297 — —
Energy and utilities 163 163 — —
Financials 268 268 — —
Healthcare 166 166 — —
Industrials 157 157 — —
Information technology 244 244 — —
Materials 51 51 — —
Telecommunications services 28 28 — —
Futures contracts 8—8—
Fixed income securities:
U.S. Treasuries 157 157 — —
Corporate - investment grade 932 — 932 —
Foreign bonds 183 — 183 —
Government agencies 2— 2—
Foreign governments 4— 4—
Municipal taxable 53 — 53 —
Corporate obligations CMO and REMIC 56 — 56 —
Other assets
Other assets 22——
Total plan assets $2,854 $1,616 $1,238 $—
1 Schedule does not include accrued income amounting to less than 0.7% of total plan assets.