PNC Bank 2015 Annual Report Download - page 97
Download and view the complete annual report
Please find page 97 of the 2015 PNC Bank annual report below. You can navigate through the pages in the report by either clicking on the pages listed below, or by using the keyword search tool below to find specific information within the annual report.-
 1
1 -
2
-
3
-
4
-
5
-
6
-
7
-
8
-
9
-
10
-
11
-
12
-
13
-
14
-
15
-
16
-
17
-
18
-
19
-
20
-
21
-
22
-
23
-
24
-
25
-
26
-
27
-
28
-
29
-
30
-
31
-
32
-
33
-
34
-
35
-
36
-
37
-
38
-
39
-
40
-
41
-
42
-
43
-
44
-
45
-
46
-
47
-
48
-
49
-
50
-
51
-
52
-
53
-
54
-
55
-
56
-
57
-
58
-
59
-
60
-
61
-
62
-
63
-
64
-
65
-
66
-
67
-
68
-
69
-
70
-
71
-
72
-
73
-
74
-
75
-
76
-
77
-
78
-
79
-
80
-
81
-
82
-
83
-
84
-
85
-
86
-
 87
87 -
 88
88 -
 89
89 -
 90
90 -
 91
91 -
 92
92 -
 93
93 -
 94
94 -
 95
95 -
 96
96 -
 97
97 -
 98
98 -
 99
99 -
 100
100 -
 101
101 -
 102
102 -
 103
103 -
 104
104 -
 105
105 -
 106
106 -
 107
107 -
108
-
109
-
110
-
111
-
112
-
113
-
114
-
115
-
116
-
117
-
118
-
119
-
120
-
121
-
122
-
123
-
124
-
125
-
126
-
127
-
128
-
129
-
130
-
131
-
132
-
133
-
134
-
135
-
136
-
137
-
138
-
139
-
140
-
141
-
142
-
143
-
144
-
145
-
146
-
147
-
148
-
149
-
150
-
151
-
152
-
153
-
154
-
155
-
156
-
157
-
158
-
159
-
160
-
161
-
162
-
163
-
164
-
165
-
166
-
167
-
168
-
169
-
170
-
171
-
172
-
173
-
174
-
175
-
176
-
177
-
178
-
179
-
180
-
181
-
182
-
183
-
184
-
185
-
186
-
187
-
188
-
189
-
190
-
191
-
192
-
193
-
194
-
195
-
196
-
197
-
198
-
199
-
200
-
201
-
202
-
203
-
204
-
205
-
206
-
207
-
208
-
209
-
210
-
211
-
212
-
213
-
214
-
215
-
216
-
217
-
218
-
219
-
220
-
221
-
222
-
223
-
224
-
225
-
226
-
227
-
228
-
229
-
230
-
231
-
232
-
233
-
234
-
235
-
236
-
237
-
238
-
239
-
240
-
241
-
242
-
243
-
244
-
245
-
246
-
247
-
248
-
249
-
250
-
251
-
252
-
253
-
254
-
255
-
256
 |
 |

estimates of the probability of the ultimate funding and losses
related to those credit exposures. Other than the estimation of
the probability of funding, this methodology is very similar to
the one we use for determining our ALLL.
We refer you to Note 1 Accounting Policies and Note 3 Asset
Quality in the Notes To Consolidated Financial Statements in
Item 8 of this Report for further information on certain key
asset quality indicators that we use to evaluate our portfolios
and establish the allowances.
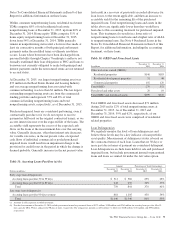
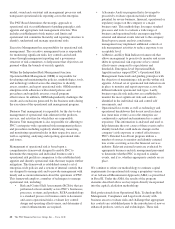
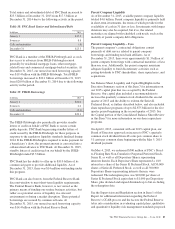
Table 36: Allowance for Loan and Lease Losses
Dollars in millions 2015 2014
January 1 $3,331 $3,609
Total net charge-offs (386) (531)
Provision for credit losses 255 273
Net change in allowance for unfunded loan
commitments and letters of credit (2) (17)
Write-offs of purchased impaired loans (a) (468)
Other (3) (3)
December 31 $2,727 $3,331
Net charge-offs to average loans (for the year
ended) .19% .27%
Allowance for loan and lease losses to total
loans (a) 1.32 1.63
Commercial lending net charge-offs $ (15) $ (55)
Consumer lending net charge-offs (371) (476)
Total net charge-offs $ (386) $ (531)
Net charge-offs to average loans (for the year
ended)
Commercial lending .01% .04%
Consumer lending .50 .62
(a) A portion of the ALLL associated with purchased impaired pooled consumer and
residential real estate loans was derecognized on December 31, 2015 due to the
change in the derecognition policy for these loans. The December 31, 2015 ratio of
ALLL to total loans was impacted by the derecognition. For additional information
see Note 4 Purchased Loans in the Notes To Consolidated Financial Statements in
Item 8 of this Report.
The provision for credit losses decreased to $255 million for
2015 compared to $273 million for 2014 due to improved
credit quality. For 2015, the provision for commercial lending
credit losses decreased by $45 million, or 45%, from 2014.
The provision for consumer lending credit losses increased
$27 million, or 16%, from 2014.
At December 31, 2015, total ALLL to total nonperforming
loans was 128%. The comparable amount for December 31,
2014 was 133%. These ratios are 98% and 85%, respectively,
when excluding the $.6 billion and $1.2 billion, respectively,
of ALLL at December 31, 2015 and December 31, 2014
allocated to consumer loans and lines of credit not secured by
residential real estate and purchased impaired loans. We have
excluded consumer loans and lines of credit not secured by
real estate as they are charged off after 120 to 180 days past
due and not placed on nonperforming status. Additionally, we
have excluded purchased impaired loans as they are
considered performing regardless of their delinquency status
as interest is accreted in accordance with ASC 310-30 based
on the recorded investment balance. Additional allowance is
recorded when the net present value of expected cash flows is
lower than the recorded investment balance. See Table 28
within this Credit Risk Management section for additional
information.
The ALLL balance increases or decreases across periods in
relation to fluctuating risk factors, including asset quality
trends, net charge-offs and changes in aggregate portfolio
balances. The ALLL balance declined $.6 billion, or 18%, as
of December 31, 2015 compared to December 31, 2014.
During 2015, the decline was driven by improved asset quality
trends, including, but not limited to, delinquency status and
improving economic conditions, as well as reduced net
charge-offs, coupled with the derecognition of $468 million of
ALLL related to purchased impaired pooled consumer and
residential real estate loans. These impacts to ALLL were
partially offset by continued portfolio growth over the recent
quarters.
See Note 1 Accounting Policies and Note 4 Purchased Loans
in the Notes To Consolidated Financial Statements in Item 8
of this Report regarding changes in the ALLL and in the
allowance for unfunded loan commitments and letters of
credit.
Operational Risk Management
Operational risk is the risk of loss resulting from inadequate or
failed internal processes or systems, human factors, or
external events. This includes losses that may arise as a result
of non-compliance with laws or regulations, failure to fulfill
fiduciary responsibilities, as well as litigation or other legal
actions. Operational risk may occur in any of our business
activities and manifests itself in various ways, including but
not limited to:
• Transaction processing errors,
• Unauthorized transactions and fraud by employees or
third parties,
• Material disruption in business activities,
• System breaches and misuse of sensitive information,
• Regulatory or governmental actions, fines or
penalties, and
• Significant legal expenses, judgments or settlements.
PNC’s Operational Risk Management is inclusive of
Technology Risk Management and Business Continuity Risk.
Enterprise Compliance is responsible for coordinating the
compliance risk component of PNC’s Operational Risk
framework. Operational Risk Management focuses on
balancing business needs, regulatory expectations and risk
management priorities through an adaptive and proactive
program that is designed to provide a strong governance
The PNC Financial Services Group, Inc. – Form 10-K 79