PNC Bank 2015 Annual Report Download - page 192
Download and view the complete annual report
Please find page 192 of the 2015 PNC Bank annual report below. You can navigate through the pages in the report by either clicking on the pages listed below, or by using the keyword search tool below to find specific information within the annual report.-
 1
1 -
2
-
3
-
4
-
5
-
6
-
7
-
8
-
9
-
10
-
11
-
12
-
13
-
14
-
15
-
16
-
17
-
18
-
19
-
20
-
21
-
22
-
23
-
24
-
25
-
26
-
27
-
28
-
29
-
30
-
31
-
32
-
33
-
34
-
35
-
36
-
37
-
38
-
39
-
40
-
41
-
42
-
43
-
44
-
45
-
46
-
47
-
48
-
49
-
50
-
51
-
52
-
53
-
54
-
55
-
56
-
57
-
58
-
59
-
60
-
61
-
62
-
63
-
64
-
65
-
66
-
67
-
68
-
69
-
70
-
71
-
72
-
73
-
74
-
75
-
76
-
77
-
78
-
79
-
80
-
81
-
82
-
83
-
84
-
85
-
86
-
87
-
88
-
89
-
90
-
91
-
92
-
93
-
94
-
95
-
96
-
97
-
98
-
99
-
100
-
101
-
102
-
103
-
104
-
105
-
106
-
107
-
108
-
109
-
110
-
111
-
112
-
113
-
114
-
115
-
116
-
117
-
118
-
119
-
120
-
121
-
122
-
123
-
124
-
125
-
126
-
127
-
128
-
129
-
130
-
131
-
132
-
133
-
134
-
135
-
136
-
137
-
138
-
139
-
140
-
141
-
142
-
143
-
144
-
145
-
146
-
147
-
148
-
149
-
150
-
151
-
152
-
153
-
154
-
155
-
156
-
157
-
158
-
159
-
160
-
161
-
162
-
163
-
164
-
165
-
166
-
167
-
168
-
169
-
170
-
171
-
172
-
173
-
174
-
175
-
176
-
177
-
178
-
179
-
180
-
181
-
 182
182 -
 183
183 -
 184
184 -
 185
185 -
 186
186 -
 187
187 -
 188
188 -
 189
189 -
 190
190 -
 191
191 -
 192
192 -
 193
193 -
 194
194 -
 195
195 -
 196
196 -
 197
197 -
 198
198 -
 199
199 -
 200
200 -
 201
201 -
 202
202 -
203
-
204
-
205
-
206
-
207
-
208
-
209
-
210
-
211
-
212
-
213
-
214
-
215
-
216
-
217
-
218
-
219
-
220
-
221
-
222
-
223
-
224
-
225
-
226
-
227
-
228
-
229
-
230
-
231
-
232
-
233
-
234
-
235
-
236
-
237
-
238
-
239
-
240
-
241
-
242
-
243
-
244
-
245
-
246
-
247
-
248
-
249
-
250
-
251
-
252
-
253
-
254
-
255
-
256
 |
 |

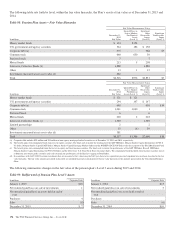
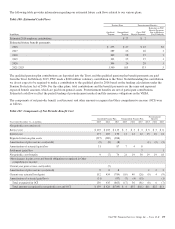
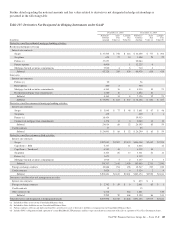
The following table sets forth by level, within the fair value hierarchy, the Plan’s assets at fair value as of December 31, 2015 and
2014.
Table 98: Pension Plan Assets – Fair Value Hierarchy
Fair Value Measurements Using:
In millions
December 31,
2015
Fair Value
Quoted Prices in
Active Markets
For Identical
Assets
(Level 1)
Significant
Other
Observable
Inputs
(Level 2)
Significant
Unobservable
Inputs
(Level 3)
Money market funds $ 154 $154
U.S. government and agency securities 324 186 $ 138
Corporate debt (a) 575 568 $7
Common stock 660 630 30
Preferred stock 77
Mutual funds 213 5 208
Interest in Collective Funds (b) 1,888 1,888
Other 13 1 12
Investments measured at net asset value (d) 482
Total $4,316 $976 $2,851 $7
Fair Value Measurements Using:
In millions
December 31,
2014
Fair Value
Quoted Prices in
Active Markets
For Identical
Assets (Level 1)
Significant
Other
Observable
Inputs
(Level 2)
Significant
Unobservable
Inputs
(Level 3)
Money market funds $ 121 $ 121
U.S. government and agency securities 294 147 $ 147
Corporate debt (a) 648 638 $10
Common stock 1,041 1,040 1
Preferred Stock 66
Mutual funds 220 2 218
Interest in Collective Funds (c) 1,589 1,589
Limited partnerships 22
Other 55 (4) 59
Investments measured at net asset value (d) 381
Total $4,357 $1,306 $2,660 $10
(a) Corporate debt includes $29 million and $34 million of non-agency mortgage-backed securities as of December 31, 2015 and 2014, respectively.
(b) The benefit plans own commingled funds that invest in equity securities. The funds seek to mirror the benchmark of the S&P 500 Index, Morgan Stanley Capital International ACWI X
US Index, Morgan Stanley Capital EAFE Index, Morgan Stanley Capital Emerging Markets Index and the NCREIF ODCE NOF Index with the exception of the BlackRock Index Fund.
(c) The benefit plans own commingled funds that invest in equity and fixed income securities. The funds seek to mirror the performance of the S&P 500 Index, Russell 3000 Index,
Morgan Stanley Capital International ACWI X US Index and the Dow Jones U.S. Select Real Estate Securities Index. The commingled fund that holds fixed income securities invests
in domestic investment grade securities and seeks to mimic the performance of the Barclays Aggregate Bond Index.
(d) In accordance with ASC 820-10, certain investments that are measured at fair value using the NAV per share (or its equivalent) practical expedient have not been classified in the fair
value hierarchy. The fair value amounts presented in this table are intended to permit reconciliation of the fair value hierarchy to the amounts presented on the Consolidated Balance
Sheet.
The following summarizes changes in the fair value of the pension plan’s Level 3 assets during 2015 and 2014.
Table 99: Rollforward of Pension Plan Level 3 Assets
In millions Corporate Debt
January 1, 2015 $10
Net realized gain/(loss) on sale of investments 1
Net unrealized gain/(loss) on assets held at end of
year
Purchases 4
Sales (8)
December 31, 2015 $ 7
In millions Corporate Debt
January 1, 2014 $13
Net realized gain/(loss) on sale of investments 3
Net unrealized gain/(loss) on assets held at end of
year
Purchases
Sales (6)
December 31, 2014 $10
174 The PNC Financial Services Group, Inc. – Form 10-K