PNC Bank 2015 Annual Report Download - page 63
Download and view the complete annual report
Please find page 63 of the 2015 PNC Bank annual report below. You can navigate through the pages in the report by either clicking on the pages listed below, or by using the keyword search tool below to find specific information within the annual report.-
 1
1 -
2
-
3
-
4
-
5
-
6
-
7
-
8
-
9
-
10
-
11
-
12
-
13
-
14
-
15
-
16
-
17
-
18
-
19
-
20
-
21
-
22
-
23
-
24
-
25
-
26
-
27
-
28
-
29
-
30
-
31
-
32
-
33
-
34
-
35
-
36
-
37
-
38
-
39
-
40
-
41
-
42
-
43
-
44
-
45
-
46
-
47
-
48
-
49
-
50
-
51
-
52
-
 53
53 -
 54
54 -
 55
55 -
 56
56 -
 57
57 -
 58
58 -
 59
59 -
 60
60 -
 61
61 -
 62
62 -
 63
63 -
 64
64 -
 65
65 -
 66
66 -
 67
67 -
 68
68 -
 69
69 -
 70
70 -
 71
71 -
 72
72 -
 73
73 -
74
-
75
-
76
-
77
-
78
-
79
-
80
-
81
-
82
-
83
-
84
-
85
-
86
-
87
-
88
-
89
-
90
-
91
-
92
-
93
-
94
-
95
-
96
-
97
-
98
-
99
-
100
-
101
-
102
-
103
-
104
-
105
-
106
-
107
-
108
-
109
-
110
-
111
-
112
-
113
-
114
-
115
-
116
-
117
-
118
-
119
-
120
-
121
-
122
-
123
-
124
-
125
-
126
-
127
-
128
-
129
-
130
-
131
-
132
-
133
-
134
-
135
-
136
-
137
-
138
-
139
-
140
-
141
-
142
-
143
-
144
-
145
-
146
-
147
-
148
-
149
-
150
-
151
-
152
-
153
-
154
-
155
-
156
-
157
-
158
-
159
-
160
-
161
-
162
-
163
-
164
-
165
-
166
-
167
-
168
-
169
-
170
-
171
-
172
-
173
-
174
-
175
-
176
-
177
-
178
-
179
-
180
-
181
-
182
-
183
-
184
-
185
-
186
-
187
-
188
-
189
-
190
-
191
-
192
-
193
-
194
-
195
-
196
-
197
-
198
-
199
-
200
-
201
-
202
-
203
-
204
-
205
-
206
-
207
-
208
-
209
-
210
-
211
-
212
-
213
-
214
-
215
-
216
-
217
-
218
-
219
-
220
-
221
-
222
-
223
-
224
-
225
-
226
-
227
-
228
-
229
-
230
-
231
-
232
-
233
-
234
-
235
-
236
-
237
-
238
-
239
-
240
-
241
-
242
-
243
-
244
-
245
-
246
-
247
-
248
-
249
-
250
-
251
-
252
-
253
-
254
-
255
-
256
 |
 |

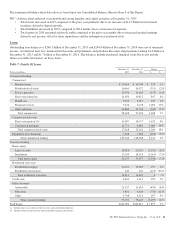
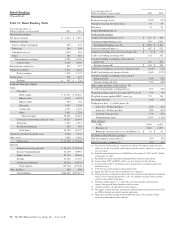
amortized cost and fair value, included in Shareholders’ equity
as Accumulated other comprehensive income or loss, net of
tax, on our Consolidated Balance Sheet. Securities classified
as held to maturity are carried at amortized cost. As of
December 31, 2015, the amortized cost and fair value of
available for sale securities totaled $55.3 billion and $55.8
billion, respectively, compared to an amortized cost and fair
value as of December 31, 2014 of $43.2 billion and $44.2
billion, respectively. The amortized cost and fair value of held
to maturity securities were $14.8 billion and $15.0 billion,
respectively, at December 31, 2015, compared to $11.6 billion
and $12.0 billion, respectively, at December 31, 2014.
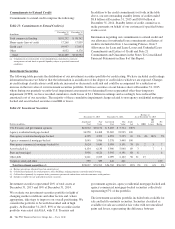
The fair value of investment securities is impacted by interest
rates, credit spreads, market volatility and liquidity conditions.
The fair value of investment securities generally decreases
when interest rates increase and vice versa. In addition, the fair
value generally decreases when credit spreads widen and vice
versa. Net unrealized gains in the total investment securities
portfolio decreased to $.7 billion at December 31, 2015 from
$1.5 billion at December 31, 2014. The comparable amounts for
the securities available for sale portfolio were $.5 billion at
December 31, 2015 and $1.1 billion at December 31, 2014.
Unrealized gains and losses on available for sale debt
securities do not impact liquidity; however these gains and
losses do affect capital under the regulatory capital rules.
Also, a change in the securities’ credit ratings could impact
the liquidity of the securities and may be indicative of a
change in credit quality, which could affect our risk-weighted
assets and, therefore, our risk-based regulatory capital ratios
under the regulatory capital rules. In addition, the amount
representing the credit-related portion of OTTI on securities
would reduce our earnings and regulatory capital ratios.
The duration of investment securities was 2.7 years at
December 31, 2015. We estimate that, at December 31, 2015,
the effective duration of investment securities was 2.8 years
for an immediate 50 basis points parallel increase in interest
rates and 2.6 years for an immediate 50 basis points parallel
decrease in interest rates. Comparable amounts at
December 31, 2014 for the effective duration of investment
securities were 2.2 years and 2.1 years, respectively.
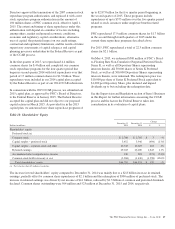
Based on current interest rates and expected prepayment
speeds, the weighed-average expected maturity of the
investment securities portfolio (excluding corporate stock and
other) was 4.8 years at December 31, 2015 compared to 4.3
years at December 31, 2014. The weighted-average expected
maturities of mortgage and other asset-backed debt securities
were as follows as of December 31, 2015:
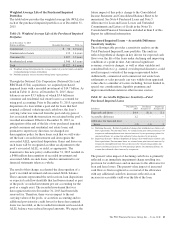
Table 15: Weighted-Average Expected Maturity of Mortgage
and Other Asset-Backed Debt Securities
December 31, 2015 Years
Agency residential mortgage-backed securities 4.8
Non-agency residential mortgage-backed securities 5.6
Agency commercial mortgage-backed securities 3.2
Non-agency commercial mortgage-backed securities 3.4
Asset-backed securities 2.9
At least quarterly, we conduct a comprehensive security-level
impairment assessment on all securities. If economic
conditions, including home prices, were to deteriorate from
current levels, and if market volatility and liquidity were to
deteriorate from current levels, or if market interest rates were
to increase or credit spreads were to widen appreciably, the
valuation of our investment securities portfolio would likely
be adversely affected and we could incur additional OTTI
credit losses that would impact our Consolidated Income
Statement.
Additional information regarding our investment securities is
included in Note 6 Investment Securities and Note 7 Fair
Value in the Notes To Consolidated Financial Statements
included in Item 8 of this Report.
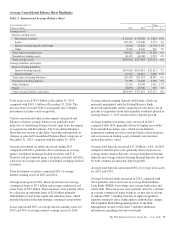
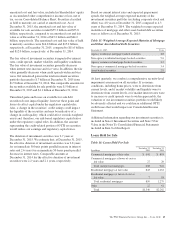
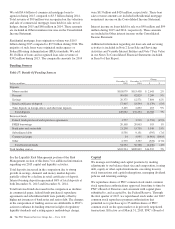
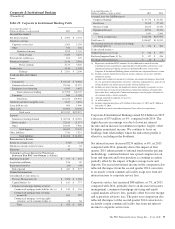
Loans Held for Sale
Table 16: Loans Held For Sale
In millions
December 31
2015
December 31
2014
Commercial mortgages at fair value $ 641 $ 893
Commercial mortgages at lower of cost or
fair value 27 29
Total commercial mortgages 668 922
Residential mortgages at fair value 843 1,261
Residential mortgages at lower of cost or
fair value 7 18
Total residential mortgages 850 1,279
Other 22 61
Total $1,540 $2,262
The PNC Financial Services Group, Inc. – Form 10-K 45