PNC Bank 2015 Annual Report Download - page 113
Download and view the complete annual report
Please find page 113 of the 2015 PNC Bank annual report below. You can navigate through the pages in the report by either clicking on the pages listed below, or by using the keyword search tool below to find specific information within the annual report.-
 1
1 -
2
-
3
-
4
-
5
-
6
-
7
-
8
-
9
-
10
-
11
-
12
-
13
-
14
-
15
-
16
-
17
-
18
-
19
-
20
-
21
-
22
-
23
-
24
-
25
-
26
-
27
-
28
-
29
-
30
-
31
-
32
-
33
-
34
-
35
-
36
-
37
-
38
-
39
-
40
-
41
-
42
-
43
-
44
-
45
-
46
-
47
-
48
-
49
-
50
-
51
-
52
-
53
-
54
-
55
-
56
-
57
-
58
-
59
-
60
-
61
-
62
-
63
-
64
-
65
-
66
-
67
-
68
-
69
-
70
-
71
-
72
-
73
-
74
-
75
-
76
-
77
-
78
-
79
-
80
-
81
-
82
-
83
-
84
-
85
-
86
-
87
-
88
-
89
-
90
-
91
-
92
-
93
-
94
-
95
-
96
-
97
-
98
-
99
-
100
-
101
-
102
-
 103
103 -
 104
104 -
 105
105 -
 106
106 -
 107
107 -
 108
108 -
 109
109 -
 110
110 -
 111
111 -
 112
112 -
 113
113 -
 114
114 -
 115
115 -
 116
116 -
 117
117 -
 118
118 -
 119
119 -
 120
120 -
 121
121 -
 122
122 -
 123
123 -
124
-
125
-
126
-
127
-
128
-
129
-
130
-
131
-
132
-
133
-
134
-
135
-
136
-
137
-
138
-
139
-
140
-
141
-
142
-
143
-
144
-
145
-
146
-
147
-
148
-
149
-
150
-
151
-
152
-
153
-
154
-
155
-
156
-
157
-
158
-
159
-
160
-
161
-
162
-
163
-
164
-
165
-
166
-
167
-
168
-
169
-
170
-
171
-
172
-
173
-
174
-
175
-
176
-
177
-
178
-
179
-
180
-
181
-
182
-
183
-
184
-
185
-
186
-
187
-
188
-
189
-
190
-
191
-
192
-
193
-
194
-
195
-
196
-
197
-
198
-
199
-
200
-
201
-
202
-
203
-
204
-
205
-
206
-
207
-
208
-
209
-
210
-
211
-
212
-
213
-
214
-
215
-
216
-
217
-
218
-
219
-
220
-
221
-
222
-
223
-
224
-
225
-
226
-
227
-
228
-
229
-
230
-
231
-
232
-
233
-
234
-
235
-
236
-
237
-
238
-
239
-
240
-
241
-
242
-
243
-
244
-
245
-
246
-
247
-
248
-
249
-
250
-
251
-
252
-
253
-
254
-
255
-
256
 |
 |
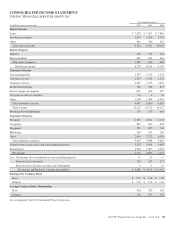
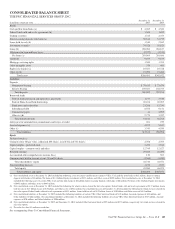
Shareholders’ Equity
Total shareholders’ equity increased $2.2 billion, to $44.6
billion at December 31, 2014 compared with December 31,
2013, primarily reflecting an increase in retained earnings,
partially offset by share repurchases of $1.2 billion under
PNC’s existing common stock repurchase authorization. The
increase in retained earnings was driven by net income of $4.2
billion, reduced by $1.2 billion of common and preferred
dividends declared. Accumulated other comprehensive
income increased slightly as the impact of market interest
rates and credit spreads on securities available for sale and
derivatives that are part of cash flow hedging strategies were
mostly offset by the impact of pension and other
postretirement benefit plan adjustments. Common shares
outstanding were 523 million at December 31, 2014 and
533 million at December 31, 2013.
Risk-Based Capital
As a result of the staggered effective dates of the final U.S.
Basel III regulatory capital rules (Basel III rules), as well as
the fact that PNC remains in the parallel run qualification
phase for the advanced approaches, PNC’s regulatory risk-
based ratios in 2014 were based on the definitions of, and
deductions from, capital under Basel III (as such definitions
and deductions were phased-in for 2014) and Basel I risk
weighted assets (subject to certain adjustments as defined by
the Basel III rules). We refer to the capital ratios calculated
using the phased-in Basel III provisions in effect for 2014 and
applicable risk-weighted assets as the 2014 Transitional
Basel III ratios.
Our 2014 Transitional Basel III ratios at December 31, 2014
were 10.9% for Tier 1 common, 10.8% for leverage, 12.6%
for Tier 1 risk-based and 15.8% for total risk-based capital.
PNC’s Basel I ratios as of December 31, 2013, which were
PNC’s effective regulatory capital ratios as of that date, were
10.5% for Tier 1 common, 11.1% for leverage, 12.4% for
Tier 1 risk-based and 15.8% for total risk-based capital.
We provide additional information on our 2014 risk-based
capital ratios in the Capital portion of the Balance Sheet
Review section in Item 7 of our 2014 Form 10-K. For
additional information on our 2014 Transitional Basel III
ratios and 2013 Basel I Tier 1 ratio, see also the Statistical
Information (Unaudited) section in Item 8 of this Report.
The PNC Financial Services Group, Inc. – Form 10-K 95