PNC Bank 2015 Annual Report Download - page 174
Download and view the complete annual report
Please find page 174 of the 2015 PNC Bank annual report below. You can navigate through the pages in the report by either clicking on the pages listed below, or by using the keyword search tool below to find specific information within the annual report.-
 1
1 -
2
-
3
-
4
-
5
-
6
-
7
-
8
-
9
-
10
-
11
-
12
-
13
-
14
-
15
-
16
-
17
-
18
-
19
-
20
-
21
-
22
-
23
-
24
-
25
-
26
-
27
-
28
-
29
-
30
-
31
-
32
-
33
-
34
-
35
-
36
-
37
-
38
-
39
-
40
-
41
-
42
-
43
-
44
-
45
-
46
-
47
-
48
-
49
-
50
-
51
-
52
-
53
-
54
-
55
-
56
-
57
-
58
-
59
-
60
-
61
-
62
-
63
-
64
-
65
-
66
-
67
-
68
-
69
-
70
-
71
-
72
-
73
-
74
-
75
-
76
-
77
-
78
-
79
-
80
-
81
-
82
-
83
-
84
-
85
-
86
-
87
-
88
-
89
-
90
-
91
-
92
-
93
-
94
-
95
-
96
-
97
-
98
-
99
-
100
-
101
-
102
-
103
-
104
-
105
-
106
-
107
-
108
-
109
-
110
-
111
-
112
-
113
-
114
-
115
-
116
-
117
-
118
-
119
-
120
-
121
-
122
-
123
-
124
-
125
-
126
-
127
-
128
-
129
-
130
-
131
-
132
-
133
-
134
-
135
-
136
-
137
-
138
-
139
-
140
-
141
-
142
-
143
-
144
-
145
-
146
-
147
-
148
-
149
-
150
-
151
-
152
-
153
-
154
-
155
-
156
-
157
-
158
-
159
-
160
-
161
-
162
-
163
-
 164
164 -
 165
165 -
 166
166 -
 167
167 -
 168
168 -
 169
169 -
 170
170 -
 171
171 -
 172
172 -
 173
173 -
 174
174 -
 175
175 -
 176
176 -
 177
177 -
 178
178 -
 179
179 -
 180
180 -
 181
181 -
 182
182 -
 183
183 -
 184
184 -
185
-
186
-
187
-
188
-
189
-
190
-
191
-
192
-
193
-
194
-
195
-
196
-
197
-
198
-
199
-
200
-
201
-
202
-
203
-
204
-
205
-
206
-
207
-
208
-
209
-
210
-
211
-
212
-
213
-
214
-
215
-
216
-
217
-
218
-
219
-
220
-
221
-
222
-
223
-
224
-
225
-
226
-
227
-
228
-
229
-
230
-
231
-
232
-
233
-
234
-
235
-
236
-
237
-
238
-
239
-
240
-
241
-
242
-
243
-
244
-
245
-
246
-
247
-
248
-
249
-
250
-
251
-
252
-
253
-
254
-
255
-
256
 |
 |

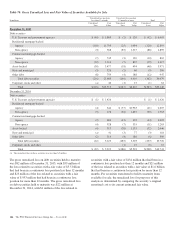
(a) Included in Other assets on the Consolidated Balance Sheet.
(b) Amounts at December 31, 2015 and December 31, 2014, are presented gross and are not reduced by the impact of legally enforceable master netting agreements that allow PNC to net
positive and negative positions and cash collateral held or placed with the same counterparty. At December 31, 2015 and December 31, 2014, the net asset amounts were $1.8 billion
and $2.6 billion, respectively, and the net liability amounts were $.6 billion and $1.4 billion, respectively.
(c) Included in Loans held for sale on the Consolidated Balance Sheet. PNC has elected the fair value option for certain residential and commercial mortgage loans held for sale.
(d) Fair value includes net unrealized gains of $23 million at December 31, 2015 compared with net unrealized gains of $54 million at December 31, 2014.
(e) Approximately 28% of these securities are residential mortgage-backed securities and 57% are U.S. Treasury and government agencies securities at December 31, 2015. Comparable
amounts at December 31, 2014 were 34% and 57%, respectively.
(f) In accordance with ASC 820-10, certain investments that are measured at fair value using the NAV per share (or its equivalent) practical expedient have not been classified in the fair
value hierarchy. The fair value amounts presented in this table are intended to permit reconciliation of the fair value hierarchy to the amounts presented on the Consolidated Balance
Sheet.
(g) Included in Federal funds sold and resale agreements on the Consolidated Balance Sheet. PNC has elected the fair value option for these items.
(h) Included in Loans on the Consolidated Balance Sheet.
(i) PNC has elected the fair value option for these shares.
(j) Included in Other liabilities on the Consolidated Balance Sheet.
(k) Included in Other borrowed funds on the Consolidated Balance Sheet.
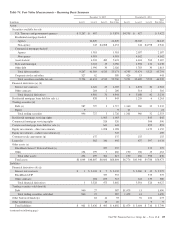
Reconciliations of assets and liabilities measured at fair value on a recurring basis using Level 3 inputs for 2015 and 2014 follow.
Table 75: Reconciliation of Level 3 Assets and Liabilities
Year Ended December 31, 2015
Total realized / unrealized
gains or losses for the period (a)
Unrealized
gains (losses)
on assets and
liabilities held on
Consolidated
Balance Sheet
at Dec. 31,
2015 (b)
Level 3 Instruments Only
In millions
Fair Value
Dec. 31,
2014
Included in
Earnings
Included
in Other
comprehensive
income Purchases Sales Issuances Settlements
Transfers
into
Level 3
Transfers
out of
Level 3
Fair Value
Dec. 31,
2015
Assets
Securities available for sale
Residential mortgage-backed non-
agency $4,798 $114 $(58) $ (846) $4,008 $ (2)
Commercial mortgage backed non-
agency 8 (8)
Asset-backed 563 20 (101) 482 (2)
State and municipal 134 (1) (118) 15
Other debt 30 2 (1) $ 13 $ (7) (7) 30
Total securities available for sale 5,525 144 (60) 13 (7) (1,080) 4,535 (4)
Financial derivatives 42 135 3 (149) 31 126
Residential mortgage loans held for sale 6 1 25 (4) $ 6 $ (29) (c) 5 1
Trading securities – Debt 32 (29) 3
Residential mortgage servicing rights 845 2 316 $ 78 (178) 1,063 5
Commercial mortgage servicing rights 506 (9) 55 63 (89) 526 (10)
Commercial mortgage loans held for sale 893 76 (56) 4,163 (4,435) 641 (5)
Equity investments – direct investments 1,152 120 274 (448) 1,098 86
Loans 397 23 114 (26) (122) 25(c) (71) (d) 340 12
Other assets
BlackRock Series C Preferred Stock 375 (18) 357 (18)
Other 15 (7) (1) 7
Total other assets 390 (18) (7) (1) 364 (18)
Total assets $9,788 $474 (e) $(60) $800 $(548) $4,304 $(6,083) $31 $(100) $8,606 $193 (f)
Liabilities
Financial derivatives (g) $ 526 $ 22 $ 1 $ (76) $ 473 $ 4
Other borrowed funds 181 (3) $ 92 (258) 12
Other liabilities 9 1 10
Total liabilities $ 716 $ 20 (e) $ 1 $ 92 $ (334) $ 495 $ 4 (f)
156 The PNC Financial Services Group, Inc. – Form 10-K