PNC Bank 2015 Annual Report Download - page 141
Download and view the complete annual report
Please find page 141 of the 2015 PNC Bank annual report below. You can navigate through the pages in the report by either clicking on the pages listed below, or by using the keyword search tool below to find specific information within the annual report.-
 1
1 -
2
-
3
-
4
-
5
-
6
-
7
-
8
-
9
-
10
-
11
-
12
-
13
-
14
-
15
-
16
-
17
-
18
-
19
-
20
-
21
-
22
-
23
-
24
-
25
-
26
-
27
-
28
-
29
-
30
-
31
-
32
-
33
-
34
-
35
-
36
-
37
-
38
-
39
-
40
-
41
-
42
-
43
-
44
-
45
-
46
-
47
-
48
-
49
-
50
-
51
-
52
-
53
-
54
-
55
-
56
-
57
-
58
-
59
-
60
-
61
-
62
-
63
-
64
-
65
-
66
-
67
-
68
-
69
-
70
-
71
-
72
-
73
-
74
-
75
-
76
-
77
-
78
-
79
-
80
-
81
-
82
-
83
-
84
-
85
-
86
-
87
-
88
-
89
-
90
-
91
-
92
-
93
-
94
-
95
-
96
-
97
-
98
-
99
-
100
-
101
-
102
-
103
-
104
-
105
-
106
-
107
-
108
-
109
-
110
-
111
-
112
-
113
-
114
-
115
-
116
-
117
-
118
-
119
-
120
-
121
-
122
-
123
-
124
-
125
-
126
-
127
-
128
-
129
-
130
-
 131
131 -
 132
132 -
 133
133 -
 134
134 -
 135
135 -
 136
136 -
 137
137 -
 138
138 -
 139
139 -
 140
140 -
 141
141 -
 142
142 -
 143
143 -
 144
144 -
 145
145 -
 146
146 -
 147
147 -
 148
148 -
 149
149 -
 150
150 -
 151
151 -
152
-
153
-
154
-
155
-
156
-
157
-
158
-
159
-
160
-
161
-
162
-
163
-
164
-
165
-
166
-
167
-
168
-
169
-
170
-
171
-
172
-
173
-
174
-
175
-
176
-
177
-
178
-
179
-
180
-
181
-
182
-
183
-
184
-
185
-
186
-
187
-
188
-
189
-
190
-
191
-
192
-
193
-
194
-
195
-
196
-
197
-
198
-
199
-
200
-
201
-
202
-
203
-
204
-
205
-
206
-
207
-
208
-
209
-
210
-
211
-
212
-
213
-
214
-
215
-
216
-
217
-
218
-
219
-
220
-
221
-
222
-
223
-
224
-
225
-
226
-
227
-
228
-
229
-
230
-
231
-
232
-
233
-
234
-
235
-
236
-
237
-
238
-
239
-
240
-
241
-
242
-
243
-
244
-
245
-
246
-
247
-
248
-
249
-
250
-
251
-
252
-
253
-
254
-
255
-
256
 |
 |

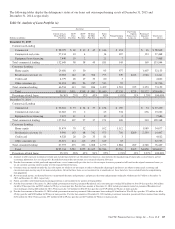
The table below presents information about the principal
balances of transferred loans that we service and are not
recorded on our Consolidated Balance Sheet. We would only
experience a loss on these transferred loans if we were
required to repurchase a loan due to a breach in
representations and warranties or a loss sharing arrangement
associated with our continuing involvement with these loans.
For more information regarding our recourse and repurchase
obligations, including our reserve of estimated losses, see the
Recourse and Repurchase Obligations section of Note 21
Commitments and Guarantees.
Table 51: Principal Balance, Delinquent Loans, and Net
Charge-offs Related to Serviced Loans For Others
In millions
Residential
Mortgages
Commercial
Mortgages (a)
Home Equity
Loans/Lines (b)
December 31, 2015
Total principal balance $72,898 $53,789 $2,806
Delinquent loans (c) 1,923 1,057 904
December 31, 2014
Total principal balance $79,108 $60,873 $3,833
Delinquent loans (c) 2,657 707 1,303
Year ended
December 31, 2015
Net charge-offs (d) $ 117 $ 595 $ 28
Year ended
December 31, 2014
Net charge-offs (d) $ 136 $ 1,288 $ 61
(a) Represents information at the securitization level in which PNC has sold loans and is
the servicer for the securitization.
(b) These activities were part of an acquired brokered home equity lending business in
which PNC is no longer engaged.
(c) Serviced delinquent loans are 90 days or more past due or are in process of
foreclosure.
(d) Net charge-offs for Residential mortgages and Home equity loans/lines represent
credit losses less recoveries distributed and as reported to investors during the
period. Net charge-offs for Commercial mortgages represent credit losses less
recoveries distributed and as reported by the trustee for commercial mortgage
backed securitizations. Realized losses for Agency securitizations are not reflected
as we do not manage the underlying real estate upon foreclosure and, as such, do not
have access to loss information.
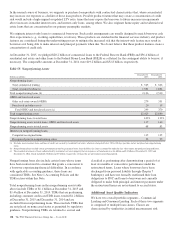
Variable Interest Entities (VIEs)
We are involved with various entities in the normal course of
business that are deemed to be VIEs. We assess VIEs for
consolidation based upon the accounting policies described in
Note 1 Accounting Policies. The following provides a
summary of VIEs, including those that we have consolidated
and those in which we hold variable interests but have not
consolidated into our financial statements as of December 31,
2015 and December 31, 2014. We have not provided
additional financial support to these entities which we are not
contractually required to provide.
Table 52: Consolidated VIEs – Carrying Value (a) (b)
In millions
Credit Card and Other
Securitization Trusts
Tax Credit
Investments Total
December 31, 2015
Assets
Cash and due from
banks $ 11 $ 11
Interest-earning
deposits with
banks 4 4
Loans $1,335 6 1,341
Allowance for loan
and lease losses (48) (48)
Equity investments 183 183
Other assets 22 380 402
Total assets $1,309 $584 $1,893
Liabilities
Other borrowed
funds $148 $ 148
Accrued expenses 44 44
Other liabilities 202 202
Total liabilities $394 $ 394
December 31, 2014
Assets
Cash and due from
banks $ 6 $ 6
Interest-earning
deposits with
banks 6 6
Loans $1,606 1,606
Allowance for loan
and lease losses (50) (50)
Equity investments 492 492
Other assets 31 452 483
Total assets $1,587 $956 $2,543
Liabilities
Other borrowed
funds $ 166 $181 $ 347
Accrued expenses 70 70
Other liabilities 206 206
Total liabilities $ 166 $457 $ 623
(a) Amounts represent carrying value on PNC’s Consolidated Balance Sheet.
(b) Difference between total assets and total liabilities represents the equity portion of
the VIE or intercompany assets and liabilities which are eliminated in consolidation.
The PNC Financial Services Group, Inc. – Form 10-K 123