PNC Bank 2015 Annual Report Download - page 204
Download and view the complete annual report
Please find page 204 of the 2015 PNC Bank annual report below. You can navigate through the pages in the report by either clicking on the pages listed below, or by using the keyword search tool below to find specific information within the annual report.-
 1
1 -
2
-
3
-
4
-
5
-
6
-
7
-
8
-
9
-
10
-
11
-
12
-
13
-
14
-
15
-
16
-
17
-
18
-
19
-
20
-
21
-
22
-
23
-
24
-
25
-
26
-
27
-
28
-
29
-
30
-
31
-
32
-
33
-
34
-
35
-
36
-
37
-
38
-
39
-
40
-
41
-
42
-
43
-
44
-
45
-
46
-
47
-
48
-
49
-
50
-
51
-
52
-
53
-
54
-
55
-
56
-
57
-
58
-
59
-
60
-
61
-
62
-
63
-
64
-
65
-
66
-
67
-
68
-
69
-
70
-
71
-
72
-
73
-
74
-
75
-
76
-
77
-
78
-
79
-
80
-
81
-
82
-
83
-
84
-
85
-
86
-
87
-
88
-
89
-
90
-
91
-
92
-
93
-
94
-
95
-
96
-
97
-
98
-
99
-
100
-
101
-
102
-
103
-
104
-
105
-
106
-
107
-
108
-
109
-
110
-
111
-
112
-
113
-
114
-
115
-
116
-
117
-
118
-
119
-
120
-
121
-
122
-
123
-
124
-
125
-
126
-
127
-
128
-
129
-
130
-
131
-
132
-
133
-
134
-
135
-
136
-
137
-
138
-
139
-
140
-
141
-
142
-
143
-
144
-
145
-
146
-
147
-
148
-
149
-
150
-
151
-
152
-
153
-
154
-
155
-
156
-
157
-
158
-
159
-
160
-
161
-
162
-
163
-
164
-
165
-
166
-
167
-
168
-
169
-
170
-
171
-
172
-
173
-
174
-
175
-
176
-
177
-
178
-
179
-
180
-
181
-
182
-
183
-
184
-
185
-
186
-
187
-
188
-
189
-
190
-
191
-
192
-
193
-
 194
194 -
 195
195 -
 196
196 -
 197
197 -
 198
198 -
 199
199 -
 200
200 -
 201
201 -
 202
202 -
 203
203 -
 204
204 -
 205
205 -
 206
206 -
 207
207 -
 208
208 -
 209
209 -
 210
210 -
 211
211 -
 212
212 -
 213
213 -
 214
214 -
215
-
216
-
217
-
218
-
219
-
220
-
221
-
222
-
223
-
224
-
225
-
226
-
227
-
228
-
229
-
230
-
231
-
232
-
233
-
234
-
235
-
236
-
237
-
238
-
239
-
240
-
241
-
242
-
243
-
244
-
245
-
246
-
247
-
248
-
249
-
250
-
251
-
252
-
253
-
254
-
255
-
256
 |
 |

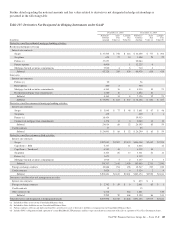
The following derivative Table 117 shows the impact legally enforceable master netting agreements had on our derivative assets
and derivative liabilities as of December 31, 2015 and December 31, 2014. The table includes cash collateral held or pledged under
legally enforceable master netting agreements. The table also includes the fair value of any securities collateral held or pledged
under legally enforceable master netting agreements. Cash and securities collateral amounts are included in the table only to the
extent of the related net derivative fair values.
Refer to Note 21 Commitments and Guarantees for additional information related to resale and repurchase agreements offsetting.
Table 117: Derivative Assets and Liabilities Offsetting
Gross
Fair Value
Amounts
Offset on the
Consolidated Balance Sheet
Net
Fair Value
Securities
Collateral
Held/(Pledged)
Under Master
Netting
Agreements
Net
Amounts
December 31, 2015
In millions
Fair Value
Offset Amount
Cash
Collateral
Derivative assets
Interest rate contracts:
Cleared $1,003 $ 779 $195 $ 29 $ 29
Over-the-counter 3,652 1,645 342 1,665 $178 1,487
Foreign exchange contracts 284 129 13 142 2 140
Credit contracts 2 1 1
Total derivative assets $4,941 $2,554 $551 $1,836 (a) $180 $1,656
Derivative liabilities
Interest rate contracts:
Cleared $ 855 $ 779 $ 57 $ 19 $ 19
Exchange-traded 1 1 1
Over-the-counter 2,276 1,687 530 59 59
Foreign exchange contracts 204 85 20 99 99
Credit contracts 4 3 1
Other contracts 462 462 462
Total derivative liabilities $3,802 $2,554 $608 $ 640 (b) $ 640
December 31, 2014
In millions
Derivative assets
Interest rate contracts $4,918 $1,981 $458 $2,479 $143 $2,336
Foreign exchange contracts 314 159 47 108 1 107
Credit contracts 2 1 1
Total derivative assets (c) $5,234 $2,141 $506 $2,587 (a) $144 $2,443
Derivative liabilities
Interest rate contracts $3,272 $2,057 $483 $ 732 $ 732
Foreign exchange contracts 241 80 20 141 141
Credit contracts 4 4
Other contracts 510 510 510
Total derivative liabilities (c) $4,027 $2,141 $503 $1,383 (b) $1,383
(a) Represents the net amount of derivative assets included in Other assets on our Consolidated Balance Sheet.
(b) Represents the net amount of derivative liabilities included in Other liabilities on our Consolidated Balance Sheet.
(c) As of December 31, 2014, cleared derivatives were not subject to offsetting. Gross derivative assets and derivative liabilities for cleared derivatives totaled $807 million and $657
million, respectively, at December 31, 2014. Derivative assets and liabilities related to exchange-traded contracts were not material at December 31, 2014.
186 The PNC Financial Services Group, Inc. – Form 10-K