PNC Bank 2015 Annual Report Download - page 155
Download and view the complete annual report
Please find page 155 of the 2015 PNC Bank annual report below. You can navigate through the pages in the report by either clicking on the pages listed below, or by using the keyword search tool below to find specific information within the annual report.-
 1
1 -
2
-
3
-
4
-
5
-
6
-
7
-
8
-
9
-
10
-
11
-
12
-
13
-
14
-
15
-
16
-
17
-
18
-
19
-
20
-
21
-
22
-
23
-
24
-
25
-
26
-
27
-
28
-
29
-
30
-
31
-
32
-
33
-
34
-
35
-
36
-
37
-
38
-
39
-
40
-
41
-
42
-
43
-
44
-
45
-
46
-
47
-
48
-
49
-
50
-
51
-
52
-
53
-
54
-
55
-
56
-
57
-
58
-
59
-
60
-
61
-
62
-
63
-
64
-
65
-
66
-
67
-
68
-
69
-
70
-
71
-
72
-
73
-
74
-
75
-
76
-
77
-
78
-
79
-
80
-
81
-
82
-
83
-
84
-
85
-
86
-
87
-
88
-
89
-
90
-
91
-
92
-
93
-
94
-
95
-
96
-
97
-
98
-
99
-
100
-
101
-
102
-
103
-
104
-
105
-
106
-
107
-
108
-
109
-
110
-
111
-
112
-
113
-
114
-
115
-
116
-
117
-
118
-
119
-
120
-
121
-
122
-
123
-
124
-
125
-
126
-
127
-
128
-
129
-
130
-
131
-
132
-
133
-
134
-
135
-
136
-
137
-
138
-
139
-
140
-
141
-
142
-
143
-
144
-
 145
145 -
 146
146 -
 147
147 -
 148
148 -
 149
149 -
 150
150 -
 151
151 -
 152
152 -
 153
153 -
 154
154 -
 155
155 -
 156
156 -
 157
157 -
 158
158 -
 159
159 -
 160
160 -
 161
161 -
 162
162 -
 163
163 -
 164
164 -
 165
165 -
166
-
167
-
168
-
169
-
170
-
171
-
172
-
173
-
174
-
175
-
176
-
177
-
178
-
179
-
180
-
181
-
182
-
183
-
184
-
185
-
186
-
187
-
188
-
189
-
190
-
191
-
192
-
193
-
194
-
195
-
196
-
197
-
198
-
199
-
200
-
201
-
202
-
203
-
204
-
205
-
206
-
207
-
208
-
209
-
210
-
211
-
212
-
213
-
214
-
215
-
216
-
217
-
218
-
219
-
220
-
221
-
222
-
223
-
224
-
225
-
226
-
227
-
228
-
229
-
230
-
231
-
232
-
233
-
234
-
235
-
236
-
237
-
238
-
239
-
240
-
241
-
242
-
243
-
244
-
245
-
246
-
247
-
248
-
249
-
250
-
251
-
252
-
253
-
254
-
255
-
256
 |
 |

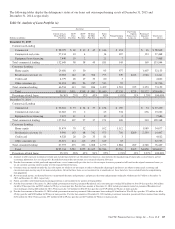
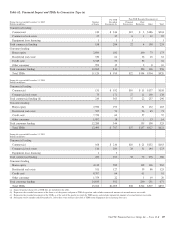
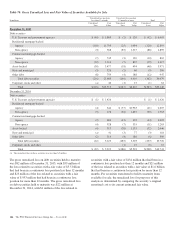
Table 62: Financial Impact and TDRs by Concession Type (a)
Number
of Loans
Pre-TDR
Recorded
Investment (b)
Post-TDR Recorded Investment (c)
During the year ended December 31, 2015
Dollars in millions
Principal
Forgiveness
Rate
Reduction Other Total
Commercial lending
Commercial 130 $ 246 $15 $ 3 $186 $204
Commercial real estate 27 37 6 1 12 19
Equipment lease financing 1 1 1 1
Total commercial lending 158 284 22 4 198 224
Consumer lending
Home equity 2,890 182 100 73 173
Residential real estate 530 61 36 25 61
Credit card 6,549 53 52 52
Other consumer 993 15 2 8 10
Total consumer lending 10,962 311 190 106 296
Total TDRs 11,120 $ 595 $22 $194 $304 $520
During the year ended December 31, 2014
Dollars in millions
Commercial lending
Commercial 131 $ 192 $10 $ 11 $137 $158
Commercial real estate 79 171 27 11 100 138
Total commercial lending (d) 210 363 37 22 237 296
Consumer lending
Home equity 2,950 193 51 132 183
Residential real estate 527 73 26 45 71
Credit card 7,720 60 57 57
Other consumer 1,092 18 1 13 14
Total consumer lending 12,289 344 135 190 325
Total TDRs 12,499 $ 707 $37 $157 $427 $621
During the year ended December 31, 2013
Dollars in millions
Commercial lending
Commercial 168 $ 216 $10 $ 21 $132 $163
Commercial real estate 116 284 28 51 144 223
Equipment lease financing 1 3
Total commercial lending 285 503 38 72 276 386
Consumer lending
Home equity 4,132 289 139 126 265
Residential real estate 911 127 39 86 125
Credit card 8,397 64 61 61
Other consumer 1,379 22 1 19 20
Total consumer lending 14,819 502 240 231 471
Total TDRs 15,104 $1,005 $38 $312 $507 $857
(a) Impact of partial charge-offs at TDR date are included in this table.
(b) Represents the recorded investment of the loans as of the quarter end prior to TDR designation, and excludes immaterial amounts of accrued interest receivable.
(c) Represents the recorded investment of the TDRs as of the end of the quarter in which the TDR occurs, and excludes immaterial amounts of accrued interest receivable.
(d) During the twelve months ended December 31, 2014, there were no loans classified as TDRs in the Equipment lease financing loan class.
The PNC Financial Services Group, Inc. – Form 10-K 137