PNC Bank 2015 Annual Report Download - page 59
Download and view the complete annual report
Please find page 59 of the 2015 PNC Bank annual report below. You can navigate through the pages in the report by either clicking on the pages listed below, or by using the keyword search tool below to find specific information within the annual report.-
 1
1 -
2
-
3
-
4
-
5
-
6
-
7
-
8
-
9
-
10
-
11
-
12
-
13
-
14
-
15
-
16
-
17
-
18
-
19
-
20
-
21
-
22
-
23
-
24
-
25
-
26
-
27
-
28
-
29
-
30
-
31
-
32
-
33
-
34
-
35
-
36
-
37
-
38
-
39
-
40
-
41
-
42
-
43
-
44
-
45
-
46
-
47
-
48
-
 49
49 -
 50
50 -
 51
51 -
 52
52 -
 53
53 -
 54
54 -
 55
55 -
 56
56 -
 57
57 -
 58
58 -
 59
59 -
 60
60 -
 61
61 -
 62
62 -
 63
63 -
 64
64 -
 65
65 -
 66
66 -
 67
67 -
 68
68 -
 69
69 -
70
-
71
-
72
-
73
-
74
-
75
-
76
-
77
-
78
-
79
-
80
-
81
-
82
-
83
-
84
-
85
-
86
-
87
-
88
-
89
-
90
-
91
-
92
-
93
-
94
-
95
-
96
-
97
-
98
-
99
-
100
-
101
-
102
-
103
-
104
-
105
-
106
-
107
-
108
-
109
-
110
-
111
-
112
-
113
-
114
-
115
-
116
-
117
-
118
-
119
-
120
-
121
-
122
-
123
-
124
-
125
-
126
-
127
-
128
-
129
-
130
-
131
-
132
-
133
-
134
-
135
-
136
-
137
-
138
-
139
-
140
-
141
-
142
-
143
-
144
-
145
-
146
-
147
-
148
-
149
-
150
-
151
-
152
-
153
-
154
-
155
-
156
-
157
-
158
-
159
-
160
-
161
-
162
-
163
-
164
-
165
-
166
-
167
-
168
-
169
-
170
-
171
-
172
-
173
-
174
-
175
-
176
-
177
-
178
-
179
-
180
-
181
-
182
-
183
-
184
-
185
-
186
-
187
-
188
-
189
-
190
-
191
-
192
-
193
-
194
-
195
-
196
-
197
-
198
-
199
-
200
-
201
-
202
-
203
-
204
-
205
-
206
-
207
-
208
-
209
-
210
-
211
-
212
-
213
-
214
-
215
-
216
-
217
-
218
-
219
-
220
-
221
-
222
-
223
-
224
-
225
-
226
-
227
-
228
-
229
-
230
-
231
-
232
-
233
-
234
-
235
-
236
-
237
-
238
-
239
-
240
-
241
-
242
-
243
-
244
-
245
-
246
-
247
-
248
-
249
-
250
-
251
-
252
-
253
-
254
-
255
-
256
 |
 |

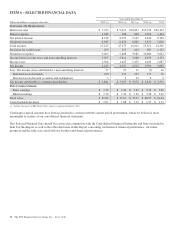
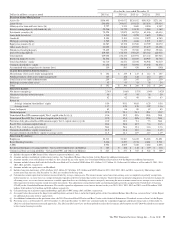
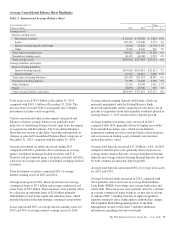
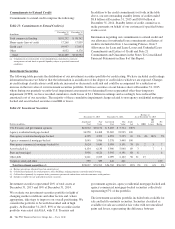
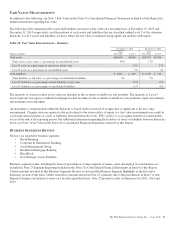
The summarized balance sheet data above is based upon our Consolidated Balance Sheet in Item 8 of this Report.
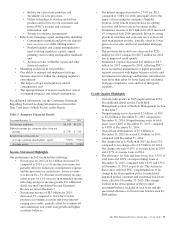
PNC’s balance sheet reflected asset growth and strong liquidity and capital positions at December 31, 2015.
• Total assets increased in 2015 compared to the prior year primarily due to an increase of $14.7 billion in investment
securities driven by deposit growth.
• Total liabilities increased in 2015 compared to 2014 mainly due to an increase in deposits.
• Total equity in 2015 remained relatively stable compared to the prior year mainly due to increased retained earnings
driven by net income, offset by share repurchases and the redemption of preferred stock.
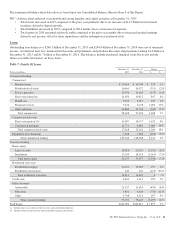
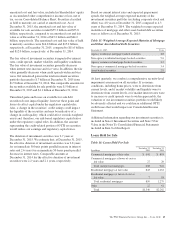
Loans
Outstanding loan balances of $206.7 billion at December 31, 2015 and $204.8 billion at December 31, 2014 were net of unearned
income, net deferred loan fees, unamortized discounts and premiums, and purchase discounts and premiums totaling $1.4 billion at
December 31, 2015 and $1.7 billion at December 31, 2014. The balances include purchased impaired loans but do not include
future accretable net interest on those loans.
Table 7: Details Of Loans
December 31 December 31 Change
Dollars in millions 2015 2014 $ %
Commercial lending
Commercial
Manufacturing $ 19,014 $ 18,744 $ 270 1%
Retail/wholesale trade 16,661 16,972 (311) (2)%
Service providers 13,970 14,103 (133) (1)%
Real estate related (a) 11,659 10,812 847 8%
Health care 9,210 9,017 193 2%
Financial services 7,234 6,178 1,056 17%
Other industries 20,860 21,594 (734) (3)%
Total commercial 98,608 97,420 1,188 1%
Commercial real estate
Real estate projects (b) 15,697 14,577 1,120 8%
Commercial mortgage 11,771 8,685 3,086 36%
Total commercial real estate 27,468 23,262 4,206 18%
Equipment lease financing 7,468 7,686 (218) (3)%
Total commercial lending 133,544 128,368 5,176 4%
Consumer lending
Home equity
Lines of credit 18,828 20,361 (1,533) (8)%
Installment 13,305 14,316 (1,011) (7)%
Total home equity 32,133 34,677 (2,544) (7)%
Residential real estate
Residential mortgage 14,162 13,885 277 2%
Residential construction 249 522 (273) (52)%
Total residential real estate 14,411 14,407 4 –%
Credit card 4,862 4,612 250 5%
Other consumer
Automobile 11,157 11,616 (459) (4)%
Education 5,881 6,626 (745) (11)%
Other 4,708 4,511 197 4%
Total consumer lending 73,152 76,449 (3,297) (4)%
Total Loans $206,696 $204,817 $ 1,879 1%
(a) Includes loans to customers in the real estate and construction industries.
(b) Includes both construction loans and intermediate financing for projects.
The PNC Financial Services Group, Inc. – Form 10-K 41