PNC Bank 2015 Annual Report Download - page 230
Download and view the complete annual report
Please find page 230 of the 2015 PNC Bank annual report below. You can navigate through the pages in the report by either clicking on the pages listed below, or by using the keyword search tool below to find specific information within the annual report.-
 1
1 -
2
-
3
-
4
-
5
-
6
-
7
-
8
-
9
-
10
-
11
-
12
-
13
-
14
-
15
-
16
-
17
-
18
-
19
-
20
-
21
-
22
-
23
-
24
-
25
-
26
-
27
-
28
-
29
-
30
-
31
-
32
-
33
-
34
-
35
-
36
-
37
-
38
-
39
-
40
-
41
-
42
-
43
-
44
-
45
-
46
-
47
-
48
-
49
-
50
-
51
-
52
-
53
-
54
-
55
-
56
-
57
-
58
-
59
-
60
-
61
-
62
-
63
-
64
-
65
-
66
-
67
-
68
-
69
-
70
-
71
-
72
-
73
-
74
-
75
-
76
-
77
-
78
-
79
-
80
-
81
-
82
-
83
-
84
-
85
-
86
-
87
-
88
-
89
-
90
-
91
-
92
-
93
-
94
-
95
-
96
-
97
-
98
-
99
-
100
-
101
-
102
-
103
-
104
-
105
-
106
-
107
-
108
-
109
-
110
-
111
-
112
-
113
-
114
-
115
-
116
-
117
-
118
-
119
-
120
-
121
-
122
-
123
-
124
-
125
-
126
-
127
-
128
-
129
-
130
-
131
-
132
-
133
-
134
-
135
-
136
-
137
-
138
-
139
-
140
-
141
-
142
-
143
-
144
-
145
-
146
-
147
-
148
-
149
-
150
-
151
-
152
-
153
-
154
-
155
-
156
-
157
-
158
-
159
-
160
-
161
-
162
-
163
-
164
-
165
-
166
-
167
-
168
-
169
-
170
-
171
-
172
-
173
-
174
-
175
-
176
-
177
-
178
-
179
-
180
-
181
-
182
-
183
-
184
-
185
-
186
-
187
-
188
-
189
-
190
-
191
-
192
-
193
-
194
-
195
-
196
-
197
-
198
-
199
-
200
-
201
-
202
-
203
-
204
-
205
-
206
-
207
-
208
-
209
-
210
-
211
-
212
-
213
-
214
-
215
-
216
-
217
-
218
-
219
-
 220
220 -
 221
221 -
 222
222 -
 223
223 -
 224
224 -
 225
225 -
 226
226 -
 227
227 -
 228
228 -
 229
229 -
 230
230 -
 231
231 -
 232
232 -
 233
233 -
 234
234 -
 235
235 -
 236
236 -
 237
237 -
 238
238 -
 239
239 -
 240
240 -
241
-
242
-
243
-
244
-
245
-
246
-
247
-
248
-
249
-
250
-
251
-
252
-
253
-
254
-
255
-
256
 |
 |

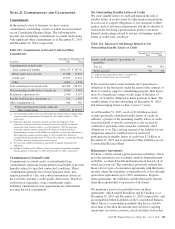
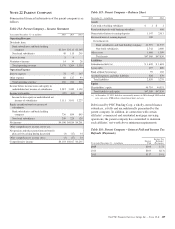
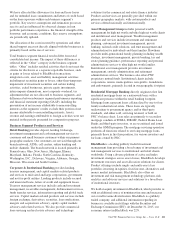
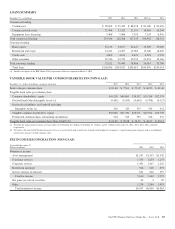
PNC received cash dividends from BlackRock of $320 million, $285 million, and $249 million during 2015, 2014, and 2013,
respectively.
Non-Strategic Assets Portfolio includes a consumer portfolio of mainly residential mortgage and brokered home equity loans and
lines of credit and a small commercial/commercial real estate loan and lease portfolio. We obtained a significant portion of these
non-strategic assets through acquisitions of other companies.
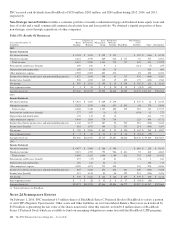
Table 138: Results Of Businesses
Year ended December 31
In millions
Retail
Banking
Corporate &
Institutional
Banking
Asset
Management
Group
Residential
Mortgage
Banking BlackRock
Non-Strategic
Assets
Portfolio Other Consolidated
2015
Income Statement
Net interest income $ 4,224 $ 3,365 $ 292 $ 121 $ 392 $ (116) $ 8,278
Noninterest income 2,223 1,935 869 613 $ 717 53 537 6,947
Total revenue 6,447 5,300 1,161 734 717 445 421 15,225
Provision for credit losses (benefit) 259 106 9 2 (114) (7) 255
Depreciation and amortization 169 145 44 15 436 809
Other noninterest expense 4,592 2,003 802 676 83 498 8,654
Income (loss) before income taxes and noncontrolling interests 1,427 3,046 306 41 717 476 (506) 5,507
Income taxes (benefit) 520 1,015 112 15 169 175 (642) 1,364
Net income $ 907 $ 2,031 $ 194 $ 26 $ 548 $ 301 $ 136 $ 4,143
Inter-segment revenue $ 1 $ 24 $ 9 $ 20 $ 15 $ (8) $ (61)
Average Assets (a) $73,240 $132,032 $7,920 $6,840 $6,983 $6,706 $121,243 $354,964
2014
Income Statement
Net interest income $ 3,923 $ 3,605 $ 289 $ 149 $ 547 $ 12 $ 8,525
Noninterest income 2,125 1,743 818 651 $ 703 40 770 6,850
Total revenue 6,048 5,348 1,107 800 703 587 782 15,375
Provision for credit losses (benefit) 277 107 (1) (2) (119) 11 273
Depreciation and amortization 176 135 42 12 411 776
Other noninterest expense 4,449 1,929 779 734 125 696 8,712
Income (loss) before income taxes and noncontrolling interests 1,146 3,177 287 56 703 581 (336) 5,614
Income taxes (benefit) 418 1,071 106 21 173 214 (596) 1,407
Net income $ 728 $ 2,106 $ 181 $ 35 $ 530 $ 367 $ 260 $ 4,207
Inter-segment revenue $ 2 $ 23 $ 11 $ 17 $ 16 $ (10) $ (59)
Average Assets (a) $75,046 $122,927 $7,745 $7,857 $6,640 $8,338 $ 99,300 $327,853
2013
Income Statement
Net interest income $ 4,077 $ 3,680 $ 288 $ 194 $ 689 $ 219 $ 9,147
Noninterest income 2,021 1,702 752 906 $ 621 53 810 6,865
Total revenue 6,098 5,382 1,040 1,100 621 742 1,029 16,012
Provision for credit losses (benefit) 657 (25) 10 21 (21) 1 643
Depreciation and amortization 186 128 42 11 348 715
Other noninterest expense 4,390 1,871 732 834 163 976 8,966
Income (loss) before income taxes and noncontrolling interests 865 3,408 256 234 621 600 (296) 5,688
Income taxes (benefit) 315 1,144 94 86 152 221 (536) 1,476
Net income $ 550 $ 2,264 $ 162 $ 148 $ 469 $ 379 $ 240 $ 4,212
Inter-segment revenue $ 3 $ 28 $ 12 $ 8 $ 17 $ (10) $ (58)
Average Assets (a) $74,971 $112,970 $7,366 $9,896 $6,272 $9,987 $ 84,202 $305,664
(a) Period-end balances for BlackRock.
N
OTE
24 S
UBSEQUENT
E
VENTS
On February 1, 2016, PNC transferred 0.5 million shares of BlackRock Series C Preferred Stock to BlackRock to satisfy a portion
of our LTIP obligation. Upon transfer, Other assets and Other liabilities on our Consolidated Balance Sheet were each reduced by
$138 million, representing the fair value of the shares transferred. After this transfer, we hold 0.8 million shares of BlackRock
Series C Preferred Stock which are available to fund our remaining obligation in connection with the BlackRock LTIP programs.
212 The PNC Financial Services Group, Inc. – Form 10-K