PNC Bank 2015 Annual Report Download - page 187
Download and view the complete annual report
Please find page 187 of the 2015 PNC Bank annual report below. You can navigate through the pages in the report by either clicking on the pages listed below, or by using the keyword search tool below to find specific information within the annual report.-
 1
1 -
2
-
3
-
4
-
5
-
6
-
7
-
8
-
9
-
10
-
11
-
12
-
13
-
14
-
15
-
16
-
17
-
18
-
19
-
20
-
21
-
22
-
23
-
24
-
25
-
26
-
27
-
28
-
29
-
30
-
31
-
32
-
33
-
34
-
35
-
36
-
37
-
38
-
39
-
40
-
41
-
42
-
43
-
44
-
45
-
46
-
47
-
48
-
49
-
50
-
51
-
52
-
53
-
54
-
55
-
56
-
57
-
58
-
59
-
60
-
61
-
62
-
63
-
64
-
65
-
66
-
67
-
68
-
69
-
70
-
71
-
72
-
73
-
74
-
75
-
76
-
77
-
78
-
79
-
80
-
81
-
82
-
83
-
84
-
85
-
86
-
87
-
88
-
89
-
90
-
91
-
92
-
93
-
94
-
95
-
96
-
97
-
98
-
99
-
100
-
101
-
102
-
103
-
104
-
105
-
106
-
107
-
108
-
109
-
110
-
111
-
112
-
113
-
114
-
115
-
116
-
117
-
118
-
119
-
120
-
121
-
122
-
123
-
124
-
125
-
126
-
127
-
128
-
129
-
130
-
131
-
132
-
133
-
134
-
135
-
136
-
137
-
138
-
139
-
140
-
141
-
142
-
143
-
144
-
145
-
146
-
147
-
148
-
149
-
150
-
151
-
152
-
153
-
154
-
155
-
156
-
157
-
158
-
159
-
160
-
161
-
162
-
163
-
164
-
165
-
166
-
167
-
168
-
169
-
170
-
171
-
172
-
173
-
174
-
175
-
176
-
 177
177 -
 178
178 -
 179
179 -
 180
180 -
 181
181 -
 182
182 -
 183
183 -
 184
184 -
 185
185 -
 186
186 -
 187
187 -
 188
188 -
 189
189 -
 190
190 -
 191
191 -
 192
192 -
 193
193 -
 194
194 -
 195
195 -
 196
196 -
 197
197 -
198
-
199
-
200
-
201
-
202
-
203
-
204
-
205
-
206
-
207
-
208
-
209
-
210
-
211
-
212
-
213
-
214
-
215
-
216
-
217
-
218
-
219
-
220
-
221
-
222
-
223
-
224
-
225
-
226
-
227
-
228
-
229
-
230
-
231
-
232
-
233
-
234
-
235
-
236
-
237
-
238
-
239
-
240
-
241
-
242
-
243
-
244
-
245
-
246
-
247
-
248
-
249
-
250
-
251
-
252
-
253
-
254
-
255
-
256
 |
 |

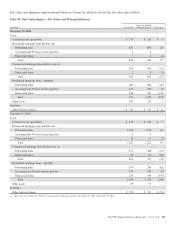
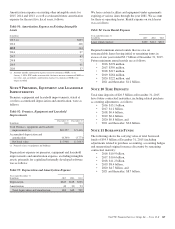
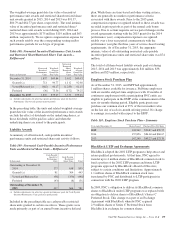
Amortization expense on existing other intangible assets for
2015, 2014 and 2013, as well as estimated future amortization
expense for the next five fiscal years, follows:
Table 91: Amortization Expense on Existing Intangible
Assets
In millions
2013 (a) $243
2014 128
2015 114
2016 97
2017 83
2018 72
2019 61
2020 37
(a) Amounts include amortization expense related to commercial MSRs. As of
January 1, 2014, PNC made an irrevocable election to measure commercial MSRs at
fair value, and, accordingly, amortization expense for commercial MSRs is no
longer recorded.
N
OTE
9P
REMISES
,E
QUIPMENT AND
L
EASEHOLD
I
MPROVEMENTS
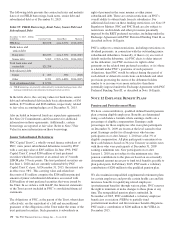
Premises, equipment and leasehold improvements, stated at
cost less accumulated depreciation and amortization, were as
follows:
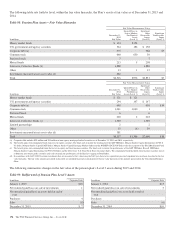
Table 92: Premises, Equipment and Leasehold
Improvements
In millions
December 31
2015
December 31
2014
Total Premises, equipment and leasehold
improvements (a) $10,257 $ 9,416
Accumulated depreciation and
amortization (4,349) (3,773)
Net book value $ 5,908 $ 5,643
(a) Primarily relates to equipment and buildings.
Depreciation expense on premises, equipment and leasehold
improvements and amortization expense, excluding intangible
assets, primarily for capitalized internally developed software
was as follows:
Table 93: Depreciation and Amortization Expense
Year ended December 31
In millions 2015 2014 2013
Depreciation $643 $618 $546
Amortization 40 30 23
Total depreciation and amortization 683 648 569
We lease certain facilities and equipment under agreements
expiring at various dates through the year 2081. We account
for these as operating leases. Rental expense on such leases
was as follows:
Table 94: Lease Rental Expense
Year ended December 31
In millions 2015 2014 2013
Lease rental expense: $460 $414 $412
Required minimum annual rentals that we owe on
noncancelable leases having initial or remaining terms in
excess of one year totaled $2.7 billion at December 31, 2015.
Future minimum annual rentals are as follows:
• 2016: $378 million,
• 2017: $350 million,
• 2018: $315 million,
• 2019: $264 million,
• 2020: $222 million, and
• 2021 and thereafter: $1.2 billion.
N
OTE
10 T
IME
D
EPOSITS
Total time deposits of $20.5 billion at December 31, 2015
have future contractual maturities, including related purchase
accounting adjustments, as follows:
• 2016: $15.1 billion,
• 2017: $1.2 billion,
• 2018: $0.4 billion,
• 2019: $0.4 billion,
• 2020: $0.8 billion, and
• 2021 and thereafter: $2.6 billion.
N
OTE
11 B
ORROWED
F
UNDS
The following shows the carrying value of total borrowed
funds of $54.5 billion at December 31, 2015 (including
adjustments related to purchase accounting, accounting hedges
and unamortized original issuance discounts) by remaining
contractual maturity:
• 2016: $10.9 billion,
• 2017: $10.6 billion,
• 2018: $11.2 billion,
• 2019: $8.4 billion,
• 2020: $4.7 billion, and
• 2021 and thereafter: $8.7 billion.
The PNC Financial Services Group, Inc. – Form 10-K 169