PNC Bank 2015 Annual Report Download - page 107
Download and view the complete annual report
Please find page 107 of the 2015 PNC Bank annual report below. You can navigate through the pages in the report by either clicking on the pages listed below, or by using the keyword search tool below to find specific information within the annual report.-
 1
1 -
2
-
3
-
4
-
5
-
6
-
7
-
8
-
9
-
10
-
11
-
12
-
13
-
14
-
15
-
16
-
17
-
18
-
19
-
20
-
21
-
22
-
23
-
24
-
25
-
26
-
27
-
28
-
29
-
30
-
31
-
32
-
33
-
34
-
35
-
36
-
37
-
38
-
39
-
40
-
41
-
42
-
43
-
44
-
45
-
46
-
47
-
48
-
49
-
50
-
51
-
52
-
53
-
54
-
55
-
56
-
57
-
58
-
59
-
60
-
61
-
62
-
63
-
64
-
65
-
66
-
67
-
68
-
69
-
70
-
71
-
72
-
73
-
74
-
75
-
76
-
77
-
78
-
79
-
80
-
81
-
82
-
83
-
84
-
85
-
86
-
87
-
88
-
89
-
90
-
91
-
92
-
93
-
94
-
95
-
96
-
 97
97 -
 98
98 -
 99
99 -
 100
100 -
 101
101 -
 102
102 -
 103
103 -
 104
104 -
 105
105 -
 106
106 -
 107
107 -
 108
108 -
 109
109 -
 110
110 -
 111
111 -
 112
112 -
 113
113 -
 114
114 -
 115
115 -
 116
116 -
 117
117 -
118
-
119
-
120
-
121
-
122
-
123
-
124
-
125
-
126
-
127
-
128
-
129
-
130
-
131
-
132
-
133
-
134
-
135
-
136
-
137
-
138
-
139
-
140
-
141
-
142
-
143
-
144
-
145
-
146
-
147
-
148
-
149
-
150
-
151
-
152
-
153
-
154
-
155
-
156
-
157
-
158
-
159
-
160
-
161
-
162
-
163
-
164
-
165
-
166
-
167
-
168
-
169
-
170
-
171
-
172
-
173
-
174
-
175
-
176
-
177
-
178
-
179
-
180
-
181
-
182
-
183
-
184
-
185
-
186
-
187
-
188
-
189
-
190
-
191
-
192
-
193
-
194
-
195
-
196
-
197
-
198
-
199
-
200
-
201
-
202
-
203
-
204
-
205
-
206
-
207
-
208
-
209
-
210
-
211
-
212
-
213
-
214
-
215
-
216
-
217
-
218
-
219
-
220
-
221
-
222
-
223
-
224
-
225
-
226
-
227
-
228
-
229
-
230
-
231
-
232
-
233
-
234
-
235
-
236
-
237
-
238
-
239
-
240
-
241
-
242
-
243
-
244
-
245
-
246
-
247
-
248
-
249
-
250
-
251
-
252
-
253
-
254
-
255
-
256
 |
 |
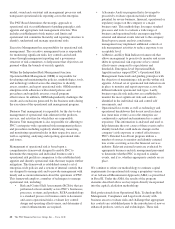
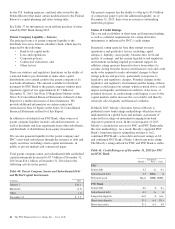
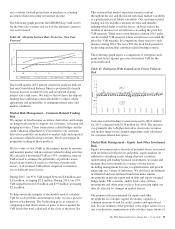
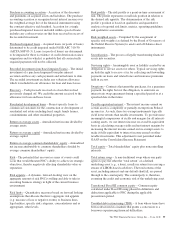
also consider forward projections of purchase accounting
accretion when forecasting net interest income.
The following graph presents the LIBOR/Swap yield curves
for the base rate scenario and each of the alternate scenarios
one year forward.
Table 46: Alternate Interest Rate Scenarios: One Year
Forward
1M
Interest Rate
0.0
Base Rates PNC Economist Market Forward Slope Flattening
1.0
2.0
3.0
2Y 3Y 5Y 10Y
The fourth quarter 2015 interest sensitivity analyses indicate
that our Consolidated Balance Sheet is positioned to benefit
from an increase in interest rates and an upward sloping
interest rate yield curve. We believe that we have the deposit
funding base and balance sheet flexibility to adjust, where
appropriate and permissible, to changing interest rates and
market conditions.
Market Risk Management – Customer-Related Trading
Risk
We engage in fixed income securities, derivatives and foreign
exchange transactions to support our customers’ investing and
hedging activities. These transactions, related hedges and the
credit valuation adjustment (CVA) related to our customer
derivatives portfolio are marked-to-market daily and reported
as customer-related trading activities. We do not engage in
proprietary trading of these products.
We use value-at-risk (VaR) as the primary means to measure
and monitor market risk in customer-related trading activities.
We calculate a diversified VaR at a 95% confidence interval.
VaR is used to estimate the probability of portfolio losses
based on the statistical analysis of historical market risk
factors. A diversified VaR reflects empirical correlations
across different asset classes.
During 2015, our 95% VaR ranged between $.8 million and
$3.6 million, averaging $2.1 million. During 2014, our 95%
VaR ranged between $.8 million and $3.9 million, averaging
$2.1 million.
To help ensure the integrity of the models used to calculate
VaR for each portfolio and enterprise-wide, we use a process
known as backtesting. The backtesting process consists of
comparing actual observations of gains or losses against the
VaR levels that were calculated at the close of the prior day.
This assumes that market exposures remain constant
throughout the day and that recent historical market variability
is a good predictor of future variability. Our customer-related
trading activity includes customer revenue and intraday
hedging which helps to reduce losses, and may reduce the
number of instances of actual losses exceeding the prior day
VaR measure. There were seven instances during 2015 under
our diversified VaR measure where actual losses exceeded the
prior day VaR measure. In comparison, there were two such
instance during 2014. We use a 500 day look back period for
backtesting and include customer-related trading revenue.
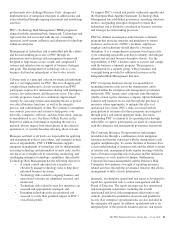
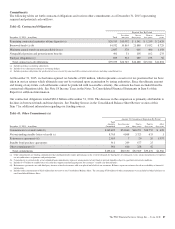
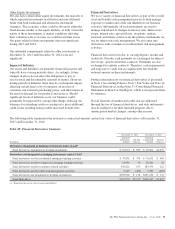
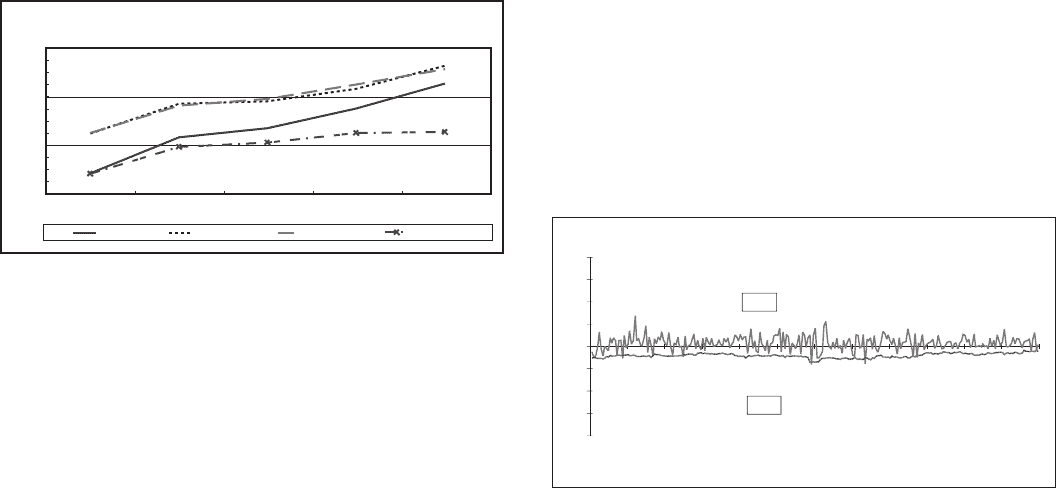
The following graph shows a comparison of enterprise-wide
gains and losses against prior day diversified VaR for the
period indicated.
Table 47: Enterprise-Wide Gains/Losses Versus Value-at-
Risk
(10)
(5)
0
5
10
15
20
Millions
P&L
(20)
(15)
(10)
12/31/14
1/31/15
2/28/15
3/31/15
4/30/15
5/31/15
6/30/15
7/31/15
9/30/15
8/31/15
10/31/15
11/30/15
12/31/15
VaR
Customer-related trading revenue increased to $210 million
for 2015 compared with $178 million for 2014. The increase
was primarily due to higher derivative client sales revenues
and market interest rate changes impacting credit valuations
for customer-related derivatives.
Market Risk Management – Equity And Other Investment
Risk
Equity investment risk is the risk of potential losses associated
with investing in both private and public equity markets. In
addition to extending credit, taking deposits, securities
underwriting and trading financial instruments, we make and
manage direct investments in a variety of transactions,
including management buyouts, recapitalizations and growth
financings in a variety of industries. We also have investments
in affiliated and non-affiliated funds that make similar
investments in private equity and in debt and equity-oriented
hedge funds. The economic and/or book value of these
investments and other assets such as loan servicing rights are
directly affected by changes in market factors.
The primary risk measurement for equity and other
investments is economic capital. Economic capital is a
common measure of risk for credit, market and operational
risk. It is an estimate of the potential value depreciation over a
one year horizon commensurate with solvency expectations of
The PNC Financial Services Group, Inc. – Form 10-K 89