PNC Bank 2015 Annual Report Download - page 74
Download and view the complete annual report
Please find page 74 of the 2015 PNC Bank annual report below. You can navigate through the pages in the report by either clicking on the pages listed below, or by using the keyword search tool below to find specific information within the annual report.-
 1
1 -
2
-
3
-
4
-
5
-
6
-
7
-
8
-
9
-
10
-
11
-
12
-
13
-
14
-
15
-
16
-
17
-
18
-
19
-
20
-
21
-
22
-
23
-
24
-
25
-
26
-
27
-
28
-
29
-
30
-
31
-
32
-
33
-
34
-
35
-
36
-
37
-
38
-
39
-
40
-
41
-
42
-
43
-
44
-
45
-
46
-
47
-
48
-
49
-
50
-
51
-
52
-
53
-
54
-
55
-
56
-
57
-
58
-
59
-
60
-
61
-
62
-
63
-
 64
64 -
 65
65 -
 66
66 -
 67
67 -
 68
68 -
 69
69 -
 70
70 -
 71
71 -
 72
72 -
 73
73 -
 74
74 -
 75
75 -
 76
76 -
 77
77 -
 78
78 -
 79
79 -
 80
80 -
 81
81 -
 82
82 -
 83
83 -
 84
84 -
85
-
86
-
87
-
88
-
89
-
90
-
91
-
92
-
93
-
94
-
95
-
96
-
97
-
98
-
99
-
100
-
101
-
102
-
103
-
104
-
105
-
106
-
107
-
108
-
109
-
110
-
111
-
112
-
113
-
114
-
115
-
116
-
117
-
118
-
119
-
120
-
121
-
122
-
123
-
124
-
125
-
126
-
127
-
128
-
129
-
130
-
131
-
132
-
133
-
134
-
135
-
136
-
137
-
138
-
139
-
140
-
141
-
142
-
143
-
144
-
145
-
146
-
147
-
148
-
149
-
150
-
151
-
152
-
153
-
154
-
155
-
156
-
157
-
158
-
159
-
160
-
161
-
162
-
163
-
164
-
165
-
166
-
167
-
168
-
169
-
170
-
171
-
172
-
173
-
174
-
175
-
176
-
177
-
178
-
179
-
180
-
181
-
182
-
183
-
184
-
185
-
186
-
187
-
188
-
189
-
190
-
191
-
192
-
193
-
194
-
195
-
196
-
197
-
198
-
199
-
200
-
201
-
202
-
203
-
204
-
205
-
206
-
207
-
208
-
209
-
210
-
211
-
212
-
213
-
214
-
215
-
216
-
217
-
218
-
219
-
220
-
221
-
222
-
223
-
224
-
225
-
226
-
227
-
228
-
229
-
230
-
231
-
232
-
233
-
234
-
235
-
236
-
237
-
238
-
239
-
240
-
241
-
242
-
243
-
244
-
245
-
246
-
247
-
248
-
249
-
250
-
251
-
252
-
253
-
254
-
255
-
256
 |
 |
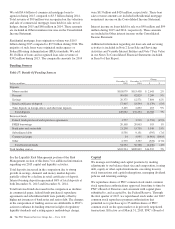
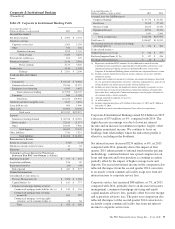
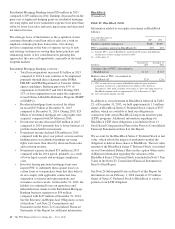
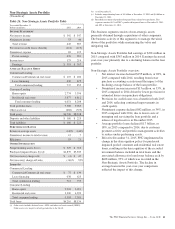
Other noninterest income increased $104 million, or 23%, in
2015 compared to 2014, driven by higher corporate securities
underwriting activity, multifamily loans originated for sale to
agencies, derivative sales, and revenue associated with credit
valuations for customer-related derivative activities.
Overall credit quality remained generally stable in 2015. The
provision for credit losses was essentially unchanged from
2014 and net charge-offs continued to be low relative to recent
historic levels. Nonperforming assets declined 7% in the year-
over-year comparison; however, there was an increase in the
fourth quarter of 2015, compared to the third quarter of 2015,
driven by deterioration in the oil and gas sector.
Noninterest expense increased $84 million, or 4%, in 2015
compared to 2014, primarily driven by investments in
technology, other costs associated with business activities and
higher asset writedowns.
Average loans increased $8.4 billion, or 8%, in 2015
compared to the prior year, and period-end loan balances
increased $4.7 billion, or 4%, at December 31, 2015 compared
to prior year-end, reflecting solid growth in Real Estate,
Corporate Banking, Business Credit and Equipment Finance:
• PNC Real Estate provides banking, financing and
servicing solutions for commercial real estate clients
across the country. Average loans for this business
increased $3.6 billion, or 13%, in 2015 compared
with 2014, due to increased originations and higher
utilization.
• Corporate Banking business provides lending,
treasury management and capital markets-related
products and services to midsized and large
corporations, government and not-for-profit entities.
Average loans for this business increased $3.4
billion, or 6%, in 2015 compared with 2014,
primarily due to an increase in loan commitments
from large corporate clients and specialty lending
businesses, partially offset by the impact of ongoing
capital and liquidity management activities.
• PNC Business Credit provides asset-based lending.
The loan portfolio is relatively high yielding, with
acceptable risk as the loans are mainly secured by
short-term assets. Average loans for this business
increased $1.3 billion, or 10%, in 2015 compared
with 2014, due to new originations.
• PNC Equipment Finance provides equipment
financing solutions for clients throughout the U.S.
and Canada. Average loans and operating leases were
$11.8 billion in 2015, an increase of $.6 billion, or
5%, compared with 2014.
Average deposits increased $7.1 billion, or 10%, in 2015
compared to the prior year, as a result of business growth and
increases in demand, money market and certificates of deposit
products.
The commercial loan servicing portfolio increased $70 billion,
or 19%, at December 31, 2015 compared to December 31,
2014, as servicing additions from new and existing customers
exceeded portfolio run-off.
Product Revenue
In addition to credit and deposit products for commercial
customers, Corporate & Institutional Banking offers other
services, including treasury management, capital markets-
related products and services, and commercial mortgage
banking activities. On a consolidated basis, the revenue from
these other services is included in net interest income,
corporate service fees and other noninterest income. From a
segment perspective, the majority of the revenue and expense
related to these services is reflected in the Corporate &
Institutional Banking segment results and the remainder is
reflected in the results of other businesses. The Other
Information section in Table 22 in the Corporate &
Institutional Banking portion of this Business Segments
Review section includes the consolidated revenue to PNC for
these services. A discussion of the consolidated revenue from
these services follows.
Treasury management revenue, comprised of fees and net
interest income from customer deposit balances, increased
$100 million, or 8%, in 2015 compared with 2014, driven by
growth in our commercial card, wholesale lockbox,
PINACLE®, funds transfer fees and liquidity-related revenue.
Capital markets-related products and services include foreign
exchange, derivatives, securities, loan syndications, mergers
and acquisitions advisory, and equity capital markets advisory
activities and related services. Revenue from capital markets-
related products and services increased $36 million, or 5%, in
2015 compared with 2014. The increase in the comparison
was primarily driven by higher derivative sales and revenue
associated with credit valuations for customer-related
derivative activities, increased corporate securities
underwriting activity and higher equity capital markets
advisory fees, partially offset by lower merger and acquisition
advisory fees.
Commercial mortgage banking activities include revenue
derived from commercial mortgage servicing (including net
interest income and noninterest income) and revenue derived
from commercial mortgage loans held for sale and related
hedges. Total commercial mortgage banking activities
increased $43 million, or 11%, in 2015 compared with 2014.
The increase in the comparison was mainly due to higher
mortgage servicing revenue and higher multifamily loans
originated for sale to agencies, partially offset by lower net
valuation adjustment on commercial mortgage servicing
rights.
56 The PNC Financial Services Group, Inc. – Form 10-K