PNC Bank 2015 Annual Report Download - page 57
Download and view the complete annual report
Please find page 57 of the 2015 PNC Bank annual report below. You can navigate through the pages in the report by either clicking on the pages listed below, or by using the keyword search tool below to find specific information within the annual report.-
 1
1 -
2
-
3
-
4
-
5
-
6
-
7
-
8
-
9
-
10
-
11
-
12
-
13
-
14
-
15
-
16
-
17
-
18
-
19
-
20
-
21
-
22
-
23
-
24
-
25
-
26
-
27
-
28
-
29
-
30
-
31
-
32
-
33
-
34
-
35
-
36
-
37
-
38
-
39
-
40
-
41
-
42
-
43
-
44
-
45
-
46
-
 47
47 -
 48
48 -
 49
49 -
 50
50 -
 51
51 -
 52
52 -
 53
53 -
 54
54 -
 55
55 -
 56
56 -
 57
57 -
 58
58 -
 59
59 -
 60
60 -
 61
61 -
 62
62 -
 63
63 -
 64
64 -
 65
65 -
 66
66 -
 67
67 -
68
-
69
-
70
-
71
-
72
-
73
-
74
-
75
-
76
-
77
-
78
-
79
-
80
-
81
-
82
-
83
-
84
-
85
-
86
-
87
-
88
-
89
-
90
-
91
-
92
-
93
-
94
-
95
-
96
-
97
-
98
-
99
-
100
-
101
-
102
-
103
-
104
-
105
-
106
-
107
-
108
-
109
-
110
-
111
-
112
-
113
-
114
-
115
-
116
-
117
-
118
-
119
-
120
-
121
-
122
-
123
-
124
-
125
-
126
-
127
-
128
-
129
-
130
-
131
-
132
-
133
-
134
-
135
-
136
-
137
-
138
-
139
-
140
-
141
-
142
-
143
-
144
-
145
-
146
-
147
-
148
-
149
-
150
-
151
-
152
-
153
-
154
-
155
-
156
-
157
-
158
-
159
-
160
-
161
-
162
-
163
-
164
-
165
-
166
-
167
-
168
-
169
-
170
-
171
-
172
-
173
-
174
-
175
-
176
-
177
-
178
-
179
-
180
-
181
-
182
-
183
-
184
-
185
-
186
-
187
-
188
-
189
-
190
-
191
-
192
-
193
-
194
-
195
-
196
-
197
-
198
-
199
-
200
-
201
-
202
-
203
-
204
-
205
-
206
-
207
-
208
-
209
-
210
-
211
-
212
-
213
-
214
-
215
-
216
-
217
-
218
-
219
-
220
-
221
-
222
-
223
-
224
-
225
-
226
-
227
-
228
-
229
-
230
-
231
-
232
-
233
-
234
-
235
-
236
-
237
-
238
-
239
-
240
-
241
-
242
-
243
-
244
-
245
-
246
-
247
-
248
-
249
-
250
-
251
-
252
-
253
-
254
-
255
-
256
 |
 |

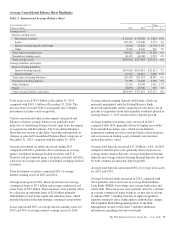
Net interest margin decreased in the comparison to the prior
year, driven by a 32 basis point decline in the yield on total
interest-earning assets, which was principally due to the
impact of increasing the company’s liquidity position, lower
loan and securities yields, and lower benefit from purchase
accounting accretion. The decline also included the impact of
the second quarter 2014 correction to reclassify certain
commercial facility fees.
We expect net interest income for the first quarter of 2016 to
be stable, compared with fourth quarter 2015 in light of an
unlikely increase in interest rates during the first quarter of
2016. For full year 2016, we expect purchase accounting
accretion to be down approximately $175 million compared to
2015.
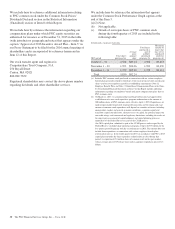
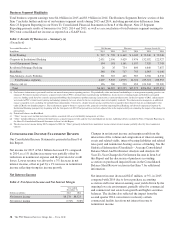
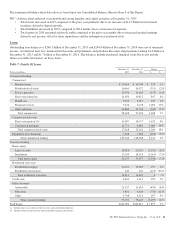
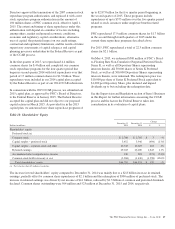
Noninterest Income
Table 5: Noninterest Income
Year ended December 31 Change
Dollars in millions 2015 2014 $ %
Noninterest income
Asset management $1,567 $1,513 $ 54 4%
Consumer services 1,335 1,254 81 6%
Corporate services 1,491 1,415 76 5%
Residential mortgage 566 618 (52) (8)%
Service charges on deposits 651 662 (11) (2)%
Net gains on sales of securities 43 4 39 *
Other 1,294 1,384 (90) (7)%
Total noninterest income $6,947 $6,850 $ 97 1%
* – Not meaningful
Noninterest income in 2015 increased compared to the prior
year, driven by strong growth in consumer and corporate
services fees and asset management revenue, partially offset
by lower gains on asset sales and lower residential mortgage
revenue. Noninterest income as a percentage of total revenue
was 46% for 2015, up from 45% for 2014.
Asset management revenue increased in 2015 compared to
2014, driven by new sales production and stronger average
equity markets, as well as the benefit from a $30 million trust
settlement during the second quarter of 2015. Discretionary
client assets under management in the Asset Management
Group were $134 billion at December 31, 2015 compared with
$135 billion at December 31, 2014.
Consumer service fees increased in the comparison to the
prior year, primarily due to growth in customer-initiated
transaction volumes related to debit card, credit card and
merchant services activity, along with higher brokerage
revenue.
Corporate service fees increased in 2015 compared to 2014,
driven by higher treasury management, commercial mortgage
servicing and equity capital markets advisory fees, partially
offset by lower mergers and acquisition advisory fees. The
increase also reflected the impact of the correction to
reclassify certain commercial facility fees from net interest
income to noninterest income beginning in the second quarter
of 2014.
Residential mortgage revenue decreased in 2015 compared to
2014, primarily due to lower loan sales and servicing revenue,
partially offset by higher net hedging gains on residential
mortgage servicing rights.
Other noninterest income decreased in 2015 compared to the
prior year, primarily attributable to lower gains on asset
dispositions, including the impact of the fourth quarter 2014
gain of $94 million on the sale of PNC’s Washington, D.C.
regional headquarters building and lower gains on sales of
Visa Class B common shares.
Gains on sales of two million Visa Class B Common shares
equaled $169 million in 2015 compared to gains of $209
million on sales of 3.5 million shares in 2014. As of
December 31, 2015, we held approximately 4.9 million Visa
Class B common shares with a fair value of approximately
$622 million and a recorded investment of approximately $31
million.
Other noninterest income typically fluctuates from period to
period depending on the nature and magnitude of transactions
completed. Further details regarding our customer-related
trading activities are included in the Market Risk
Management – Customer-Related Trading Risk portion of the
Risk Management section of this Item 7. Further details
regarding private and other equity investments are included in
the Market Risk Management – Equity And Other Investment
Risk section, and further details regarding gains or losses
related to our equity investment in BlackRock are included in
the Business Segments Review section of this Item 7.
In the first quarter of 2016, we expect fee income, consisting
of asset management, consumer services, corporate services,
residential mortgage and service charges on deposits, to be
down mid-single digits, on a percentage basis, compared with
the fourth quarter of 2015 due to seasonality and typically
lower first quarter client activity. Continued volatility in the
equity markets in combination with other economic factors
could add to pressure on noninterest income. For full year
2016, we expect modest growth in revenue.
The PNC Financial Services Group, Inc. – Form 10-K 39