PNC Bank 2015 Annual Report Download - page 189
Download and view the complete annual report
Please find page 189 of the 2015 PNC Bank annual report below. You can navigate through the pages in the report by either clicking on the pages listed below, or by using the keyword search tool below to find specific information within the annual report.-
 1
1 -
2
-
3
-
4
-
5
-
6
-
7
-
8
-
9
-
10
-
11
-
12
-
13
-
14
-
15
-
16
-
17
-
18
-
19
-
20
-
21
-
22
-
23
-
24
-
25
-
26
-
27
-
28
-
29
-
30
-
31
-
32
-
33
-
34
-
35
-
36
-
37
-
38
-
39
-
40
-
41
-
42
-
43
-
44
-
45
-
46
-
47
-
48
-
49
-
50
-
51
-
52
-
53
-
54
-
55
-
56
-
57
-
58
-
59
-
60
-
61
-
62
-
63
-
64
-
65
-
66
-
67
-
68
-
69
-
70
-
71
-
72
-
73
-
74
-
75
-
76
-
77
-
78
-
79
-
80
-
81
-
82
-
83
-
84
-
85
-
86
-
87
-
88
-
89
-
90
-
91
-
92
-
93
-
94
-
95
-
96
-
97
-
98
-
99
-
100
-
101
-
102
-
103
-
104
-
105
-
106
-
107
-
108
-
109
-
110
-
111
-
112
-
113
-
114
-
115
-
116
-
117
-
118
-
119
-
120
-
121
-
122
-
123
-
124
-
125
-
126
-
127
-
128
-
129
-
130
-
131
-
132
-
133
-
134
-
135
-
136
-
137
-
138
-
139
-
140
-
141
-
142
-
143
-
144
-
145
-
146
-
147
-
148
-
149
-
150
-
151
-
152
-
153
-
154
-
155
-
156
-
157
-
158
-
159
-
160
-
161
-
162
-
163
-
164
-
165
-
166
-
167
-
168
-
169
-
170
-
171
-
172
-
173
-
174
-
175
-
176
-
177
-
178
-
 179
179 -
 180
180 -
 181
181 -
 182
182 -
 183
183 -
 184
184 -
 185
185 -
 186
186 -
 187
187 -
 188
188 -
 189
189 -
 190
190 -
 191
191 -
 192
192 -
 193
193 -
 194
194 -
 195
195 -
 196
196 -
 197
197 -
 198
198 -
 199
199 -
200
-
201
-
202
-
203
-
204
-
205
-
206
-
207
-
208
-
209
-
210
-
211
-
212
-
213
-
214
-
215
-
216
-
217
-
218
-
219
-
220
-
221
-
222
-
223
-
224
-
225
-
226
-
227
-
228
-
229
-
230
-
231
-
232
-
233
-
234
-
235
-
236
-
237
-
238
-
239
-
240
-
241
-
242
-
243
-
244
-
245
-
246
-
247
-
248
-
249
-
250
-
251
-
252
-
253
-
254
-
255
-
256
 |
 |

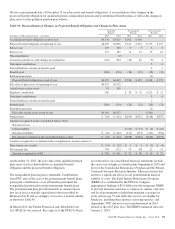
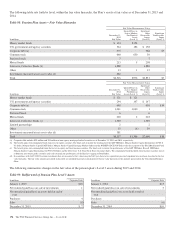
We use a measurement date of December 31 for plan assets and benefit obligations. A reconciliation of the changes in the
projected benefit obligation for qualified pension, nonqualified pension and postretirement benefit plans as well as the change in
plan assets for the qualified pension plan follows.
Table 96: Reconciliation of Changes in Projected Benefit Obligation and Change in Plan Assets
Qualified
Pension
Nonqualified
Pension
Postretirement
Benefits
December 31 (Measurement Date) – in millions 2015 2014 2015 2014 2015 2014
Accumulated benefit obligation at end of year $4,330 $4,427 $ 292 $ 316
Projected benefit obligation at beginning of year $4,499 $3,966 $ 322 $ 292 $ 379 $ 375
Service cost 107 1033355
Interest cost 177 187 11 12 15 16
Plan amendments (7)
Actuarial (gains)/losses and changes in assumptions (126) 504 (10) 40 (9) 4
Participant contributions 58
Federal Medicare subsidy on benefits paid 22
Benefits paid (260) (254) (28) (25) (28) (31)
Settlement payments (1)
Projected benefit obligation at end of year $4,397 $4,499 $ 298 $ 322 $ 368 $ 379
Fair value of plan assets at beginning of year $4,357 $4,252
Actual return on plan assets 19 359
Employer contribution 200 $ 28 $ 25 $ 222 $ 21
Participant contributions 58
Federal Medicare subsidy on benefits paid 22
Benefits paid (260) (254) (28) (25) (28) (31)
Settlement payments (1)
Fair value of plan assets at end of year $4,316 $4,357 $ 200
Funded status $ (81) $ (142) $(298) $(322) $(168) $(379)
Amounts recognized on the consolidated balance sheet
Noncurrent asset
Current liability $ (27) $ (31) $ (2) $ (25)
Noncurrent liability $ (81) $ (142) (271) (291) (166) (354)
Net amount recognized on the consolidated balance sheet $ (81) $ (142) $(298) $(322) $(168) $(379)
Amounts recognized in accumulated other comprehensive income consist of:
Prior service cost (credit) $ (13) $ (22) $ 1 $ 1 $ (3) $ (4)
Net actuarial loss 794 673 71 88 22 31
Amount recognized in AOCI $ 781 $ 651 $ 72 $ 89 $ 19 $ 27
At December 31, 2015, the fair value of the qualified pension
plan assets was less than both the accumulated benefit
obligation and the projected benefit obligation.
The nonqualified pension plan is unfunded. Contributions
from PNC and, in the case of the postretirement benefit plans,
participant contributions cover all benefits paid under the
nonqualified pension plan and postretirement benefit plans.
The postretirement plan provides benefits to certain retirees
that are at least actuarially equivalent to those provided by
Medicare Part D and accordingly, we receive a federal subsidy
as shown in Table 96.
In March 2010, the Patient Protection and Affordable Care
Act (PPACA) was enacted. Key aspects of the PPACA which
are reflected in our consolidated financial statements include
the excise tax on high-cost health plans beginning in 2018 and
fees for the Transitional Reinsurance Program and the Patient-
Centered Outcomes Research Institute. These provisions did
not have a significant effect on our postretirement medical
liability or costs. The Early Retiree Reinsurance Program
(ERRP) was established by the PPACA. Congress
appropriated funding of $5.0 billion for this temporary ERRP
to provide financial assistance to employers, unions, and state
and local governments to help them maintain coverage for
early retirees age 55 and older who are not yet eligible for
Medicare, including their spouses, surviving spouses, and
dependents. PNC did not receive reimbursement in 2014
related to the 2013 plan year. The ERRP terminated effective
January 1, 2014.
The PNC Financial Services Group, Inc. – Form 10-K 171