PNC Bank 2015 Annual Report Download - page 176
Download and view the complete annual report
Please find page 176 of the 2015 PNC Bank annual report below. You can navigate through the pages in the report by either clicking on the pages listed below, or by using the keyword search tool below to find specific information within the annual report.-
 1
1 -
2
-
3
-
4
-
5
-
6
-
7
-
8
-
9
-
10
-
11
-
12
-
13
-
14
-
15
-
16
-
17
-
18
-
19
-
20
-
21
-
22
-
23
-
24
-
25
-
26
-
27
-
28
-
29
-
30
-
31
-
32
-
33
-
34
-
35
-
36
-
37
-
38
-
39
-
40
-
41
-
42
-
43
-
44
-
45
-
46
-
47
-
48
-
49
-
50
-
51
-
52
-
53
-
54
-
55
-
56
-
57
-
58
-
59
-
60
-
61
-
62
-
63
-
64
-
65
-
66
-
67
-
68
-
69
-
70
-
71
-
72
-
73
-
74
-
75
-
76
-
77
-
78
-
79
-
80
-
81
-
82
-
83
-
84
-
85
-
86
-
87
-
88
-
89
-
90
-
91
-
92
-
93
-
94
-
95
-
96
-
97
-
98
-
99
-
100
-
101
-
102
-
103
-
104
-
105
-
106
-
107
-
108
-
109
-
110
-
111
-
112
-
113
-
114
-
115
-
116
-
117
-
118
-
119
-
120
-
121
-
122
-
123
-
124
-
125
-
126
-
127
-
128
-
129
-
130
-
131
-
132
-
133
-
134
-
135
-
136
-
137
-
138
-
139
-
140
-
141
-
142
-
143
-
144
-
145
-
146
-
147
-
148
-
149
-
150
-
151
-
152
-
153
-
154
-
155
-
156
-
157
-
158
-
159
-
160
-
161
-
162
-
163
-
164
-
165
-
 166
166 -
 167
167 -
 168
168 -
 169
169 -
 170
170 -
 171
171 -
 172
172 -
 173
173 -
 174
174 -
 175
175 -
 176
176 -
 177
177 -
 178
178 -
 179
179 -
 180
180 -
 181
181 -
 182
182 -
 183
183 -
 184
184 -
 185
185 -
 186
186 -
187
-
188
-
189
-
190
-
191
-
192
-
193
-
194
-
195
-
196
-
197
-
198
-
199
-
200
-
201
-
202
-
203
-
204
-
205
-
206
-
207
-
208
-
209
-
210
-
211
-
212
-
213
-
214
-
215
-
216
-
217
-
218
-
219
-
220
-
221
-
222
-
223
-
224
-
225
-
226
-
227
-
228
-
229
-
230
-
231
-
232
-
233
-
234
-
235
-
236
-
237
-
238
-
239
-
240
-
241
-
242
-
243
-
244
-
245
-
246
-
247
-
248
-
249
-
250
-
251
-
252
-
253
-
254
-
255
-
256
 |
 |

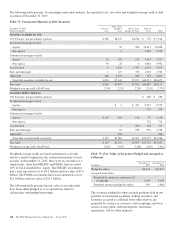
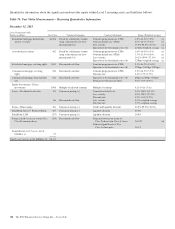
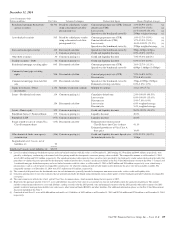
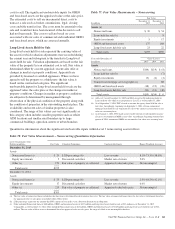
Quantitative information about the significant unobservable inputs within Level 3 recurring assets and liabilities follows.
Table 76: Fair Value Measurements – Recurring Quantitative Information
December 31, 2015
Level 3 Instruments Only
Dollars in millions Fair Value Valuation Techniques Unobservable Inputs Range (Weighted Average)
Residential mortgage-backed non-
agency securities
$4,008 Priced by a third-party vendor
using a discounted cash flow
Constant prepayment rate (CPR)
Constant default rate (CDR)
1.0%-24.2% (7.0%)
0.0%-16.7% (5.4%)
(a)
(a)
pricing model (a) Loss severity
Spread over the benchmark curve (b)
10.0%-98.5% (53.3%)
241bps weighted average
(a)
(a)
Asset-backed securities 482 Priced by a third-party vendor Constant prepayment rate (CPR) 1.0%-14.0% (6.3%) (a)
using a discounted cash flow Constant default rate (CDR) 1.7%-13.9% (6.8%) (a)
pricing model (a) Loss severity 24.2%-100% (77.5%) (a)
Spread over the benchmark curve (b) 324bps weighted average (a)
Residential mortgage servicing rights 1,063 Discounted cash flow Constant prepayment rate (CPR) 0.3%-46.5% (10.6%)
Spread over the benchmark curve (b) 559bps-1,883bps (893bps)
Commercial mortgage servicing
rights
526 Discounted cash flow Constant prepayment rate (CPR) 3.9%-26.5% (5.7%)
Discount rate 2.6%-7.7% (7.5%)
Commercial mortgage loans held for
sale
641 Discounted cash flow Spread over the benchmark curve (b) 85bps-4,270bps (547bps)
Estimated servicing cash flows 0.0%-7.0% (0.9%)
Equity investments – Direct
investments 1,098 Multiple of adjusted earnings Multiple of earnings 4.2x-14.1x (7.6x)
Loans – Residential real estate 123 Consensus pricing (c) Cumulative default rate 2.0%-100% (85.1%)
Loss severity 0.0%-100% (27.3%)
Discount rate 4.9%-7.0% (5.2%)
116 Discounted cash flow Loss severity 8.0% weighted average
Discount rate 3.9% weighted average
Loans – Home equity 101 Consensus pricing (c) Credit and Liquidity discount 26.0%-99.0% (54.0%)
BlackRock Series C Preferred Stock 357 Consensus pricing (c) Liquidity discount 20.0%
BlackRock LTIP (357) Consensus pricing (c) Liquidity discount 20.0%
Swaps related to sales of certain Visa
Class B common shares
(104) Discounted cash flow Estimated conversion factor of
Class B shares into Class A shares
Estimated growth rate of Visa
Class A share price
164.3%
16.3%
(d)
Insignificant Level 3 assets, net of
liabilities (e) 57
Total Level 3 assets, net of liabilities (f) $8,111
158 The PNC Financial Services Group, Inc. – Form 10-K