PNC Bank 2015 Annual Report Download - page 2
Download and view the complete annual report
Please find page 2 of the 2015 PNC Bank annual report below. You can navigate through the pages in the report by either clicking on the pages listed below, or by using the keyword search tool below to find specific information within the annual report.-
 1
1 -
 2
2 -
 3
3 -
 4
4 -
 5
5 -
 6
6 -
 7
7 -
 8
8 -
 9
9 -
 10
10 -
 11
11 -
 12
12 -
 13
13 -
14
-
15
-
16
-
17
-
18
-
19
-
20
-
21
-
22
-
23
-
24
-
25
-
26
-
27
-
28
-
29
-
30
-
31
-
32
-
33
-
34
-
35
-
36
-
37
-
38
-
39
-
40
-
41
-
42
-
43
-
44
-
45
-
46
-
47
-
48
-
49
-
50
-
51
-
52
-
53
-
54
-
55
-
56
-
57
-
58
-
59
-
60
-
61
-
62
-
63
-
64
-
65
-
66
-
67
-
68
-
69
-
70
-
71
-
72
-
73
-
74
-
75
-
76
-
77
-
78
-
79
-
80
-
81
-
82
-
83
-
84
-
85
-
86
-
87
-
88
-
89
-
90
-
91
-
92
-
93
-
94
-
95
-
96
-
97
-
98
-
99
-
100
-
101
-
102
-
103
-
104
-
105
-
106
-
107
-
108
-
109
-
110
-
111
-
112
-
113
-
114
-
115
-
116
-
117
-
118
-
119
-
120
-
121
-
122
-
123
-
124
-
125
-
126
-
127
-
128
-
129
-
130
-
131
-
132
-
133
-
134
-
135
-
136
-
137
-
138
-
139
-
140
-
141
-
142
-
143
-
144
-
145
-
146
-
147
-
148
-
149
-
150
-
151
-
152
-
153
-
154
-
155
-
156
-
157
-
158
-
159
-
160
-
161
-
162
-
163
-
164
-
165
-
166
-
167
-
168
-
169
-
170
-
171
-
172
-
173
-
174
-
175
-
176
-
177
-
178
-
179
-
180
-
181
-
182
-
183
-
184
-
185
-
186
-
187
-
188
-
189
-
190
-
191
-
192
-
193
-
194
-
195
-
196
-
197
-
198
-
199
-
200
-
201
-
202
-
203
-
204
-
205
-
206
-
207
-
208
-
209
-
210
-
211
-
212
-
213
-
214
-
215
-
216
-
217
-
218
-
219
-
220
-
221
-
222
-
223
-
224
-
225
-
226
-
227
-
228
-
229
-
230
-
231
-
232
-
233
-
234
-
235
-
236
-
237
-
238
-
239
-
240
-
241
-
242
-
243
-
244
-
245
-
246
-
247
-
248
-
249
-
250
-
251
-
252
-
253
-
254
-
255
-
256
 |
 |

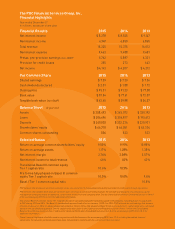
The PNC Financial Services Group, Inc.
Financial Highlights
Year ended December 31
In millions, except per share data
Financial Results 2015 2014 2013
Net interest income $ 8,278 $ 8,525 $ 9,147
Noninterest income 6,947 6,850 6,865
______ _____________________________
Total revenue 15,225 15,375 16,012
Noninterest expense 9,463 9,488 9,681
______ _____________________________
Pretax, pre-provision earnings (non-GAAP) 5,762 5,887 6,331
Provision for credit losses 255 273 643
Net income $4,143 $ 4,207 $ 4,212
Per Common Share 2015 2014 2013
Diluted earnings $ 7.39 $ 7.30 $ 7.36
Cash dividends declared $ 2.01 $ 1.88 $ 1.72
Closing price $ 95.31 $ 91.23 $ 77.58
Book value $ 81.84 $ 77.61 $ 72.07
Tangible book value (non-GAAP) $ 63.65 $ 59.88 $ 54.57
Balance Sheet At year end 2015 2014 2013
Assets $ 358,493 $ 345,072 $ 320,192
Loans $ 206,696 $ 204,817 $ 195,613
Deposits $ 249,002 $ 232,234 $ 220,931
Shareholders’ equity $ 44,710 $ 44,551 $ 42,334
Common shares outstanding 504 523 533
Selected Ratios 2015 2014 2013
Return on average common shareholders’ equity 9.50% 9.91% 10.85%
Return on average assets 1.17% 1.28% 1.38%
Net interest margin 2.74% 3.08% 3.57%
Noninterest income to total revenue 46% 45% 43%
Transitional Basel III common equity
Tier 1 capital ratio 10.6% 10.9%
Pro forma fully phased-in Basel III common
equity Tier 1 capital ratio 10.0% 10.0% 9.4%
Basel I Tier 1 common capital ratio 10.5%
PNC believes that pretax, pre-provision earnings serves as a useful tool to help evaluate the ability to provide for credit costs through operations.
PNC believes that tangible book value per common share serves as a useful tool to help evaluate the strength and discipline of a company’s capital
management strategies and as an additional, conservative measure of total company value. See the Statistical Information (Unaudited) section in Item 8
of the accompanying 2015 Form 10-K for additional information.
Transitional Basel III common equity Tier 1 capital ratios were calculated using the regulatory capital methodologies, including phase-ins, applicable
to PNC during 2015 and 2014. The Basel III standardized approach took effect on January 1, 2015. For 2014, PNC followed the methodology that became
effective on January 1, 2014 for advanced approaches banks. The pro forma fully phased-in Basel III common equity Tier 1 capital ratios were calculated
based on the standardized approach. See the capital ratios discussion in the Supervision and Regulation section of Item 1 and in the Consolidated
Balance Sheet Review section in Item 7 and see the Statistical Information (Unaudited) section in Item 8 of the accompanying 2015 Form 10-K for
additional information.
These Financial Highlights should be read in conjunction with disclosures in the accompanying 2015 Form 10-K including the audited financial
statements. Certain prior period amounts have been reclassified to conform with the current period presentation.