PNC Bank 2015 Annual Report Download - page 69
Download and view the complete annual report
Please find page 69 of the 2015 PNC Bank annual report below. You can navigate through the pages in the report by either clicking on the pages listed below, or by using the keyword search tool below to find specific information within the annual report.-
 1
1 -
2
-
3
-
4
-
5
-
6
-
7
-
8
-
9
-
10
-
11
-
12
-
13
-
14
-
15
-
16
-
17
-
18
-
19
-
20
-
21
-
22
-
23
-
24
-
25
-
26
-
27
-
28
-
29
-
30
-
31
-
32
-
33
-
34
-
35
-
36
-
37
-
38
-
39
-
40
-
41
-
42
-
43
-
44
-
45
-
46
-
47
-
48
-
49
-
50
-
51
-
52
-
53
-
54
-
55
-
56
-
57
-
58
-
 59
59 -
 60
60 -
 61
61 -
 62
62 -
 63
63 -
 64
64 -
 65
65 -
 66
66 -
 67
67 -
 68
68 -
 69
69 -
 70
70 -
 71
71 -
 72
72 -
 73
73 -
 74
74 -
 75
75 -
 76
76 -
 77
77 -
 78
78 -
 79
79 -
80
-
81
-
82
-
83
-
84
-
85
-
86
-
87
-
88
-
89
-
90
-
91
-
92
-
93
-
94
-
95
-
96
-
97
-
98
-
99
-
100
-
101
-
102
-
103
-
104
-
105
-
106
-
107
-
108
-
109
-
110
-
111
-
112
-
113
-
114
-
115
-
116
-
117
-
118
-
119
-
120
-
121
-
122
-
123
-
124
-
125
-
126
-
127
-
128
-
129
-
130
-
131
-
132
-
133
-
134
-
135
-
136
-
137
-
138
-
139
-
140
-
141
-
142
-
143
-
144
-
145
-
146
-
147
-
148
-
149
-
150
-
151
-
152
-
153
-
154
-
155
-
156
-
157
-
158
-
159
-
160
-
161
-
162
-
163
-
164
-
165
-
166
-
167
-
168
-
169
-
170
-
171
-
172
-
173
-
174
-
175
-
176
-
177
-
178
-
179
-
180
-
181
-
182
-
183
-
184
-
185
-
186
-
187
-
188
-
189
-
190
-
191
-
192
-
193
-
194
-
195
-
196
-
197
-
198
-
199
-
200
-
201
-
202
-
203
-
204
-
205
-
206
-
207
-
208
-
209
-
210
-
211
-
212
-
213
-
214
-
215
-
216
-
217
-
218
-
219
-
220
-
221
-
222
-
223
-
224
-
225
-
226
-
227
-
228
-
229
-
230
-
231
-
232
-
233
-
234
-
235
-
236
-
237
-
238
-
239
-
240
-
241
-
242
-
243
-
244
-
245
-
246
-
247
-
248
-
249
-
250
-
251
-
252
-
253
-
254
-
255
-
256
 |
 |
F
AIR
V
ALUE
M
EASUREMENTS
In addition to the following, see Note 7 Fair Value in the Notes To Consolidated Financial Statements in Item 8 of this Report for
further information regarding fair value.
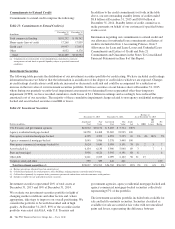
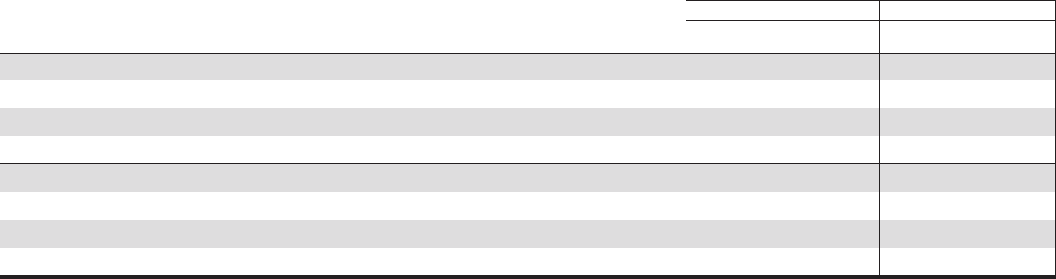
The following table summarizes the assets and liabilities measured at fair value on a recurring basis at December 31, 2015 and
December 31, 2014, respectively, and the portions of such assets and liabilities that are classified within Level 3 of the valuation
hierarchy. Level 3 assets and liabilities are those where the fair value is estimated using significant unobservable inputs.
Table 20: Fair Value Measurements – Summary
December 31, 2015 December 31, 2014
Dollars in millions
Total
Fair Value Level 3
Total
Fair Value Level 3
Total assets $68,804 $8,606 $58,973 $9,788
Total assets at fair value as a percentage of consolidated assets 19% 17%
Level 3 assets as a percentage of total assets at fair value 13% 17%
Level 3 assets as a percentage of consolidated assets 2% 3%
Total liabilities $ 4,892 $ 495 $ 5,799 $ 716
Total liabilities at fair value as a percentage of consolidated liabilities 2% 2%
Level 3 liabilities as a percentage of total liabilities at fair value 10% 12%
Level 3 liabilities as a percentage of consolidated liabilities <1% <1%
The majority of assets recorded at fair value are included in the securities available for sale portfolio. The majority of Level 3
assets represent non-agency residential mortgage-backed securities in the securities available for sale portfolio, equity investments
and mortgage servicing rights.
An instrument’s categorization within the hierarchy is based on the lowest level of input that is significant to the fair value
measurement. Changes from one quarter to the next related to the observability of inputs to a fair value measurement may result in
a reclassification (transfer) of assets or liabilities between hierarchy levels. PNC’s policy is to recognize transfers in and transfers
out as of the end of the reporting period. For additional information regarding the transfers of assets or liabilities between hierarchy
levels, see Note 7 Fair Value in the Notes To Consolidated Financial Statements in Item 8 of this Report.
B
USINESS
S
EGMENTS
R
EVIEW
We have six reportable business segments:
• Retail Banking
• Corporate & Institutional Banking
• Asset Management Group
• Residential Mortgage Banking
• BlackRock
• Non-Strategic Assets Portfolio
Business segment results, including the basis of presentation of inter-segment revenues, and a description of each business are
included in Note 23 Segment Reporting included in the Notes To Consolidated Financial Statements in Item 8 of this Report.
Certain amounts included in this Business Segments Review section and the Business Segment Highlights in the Executive
Summary section of this Item 7 differ from those amounts shown in Note 23, primarily due to the presentation in Item 7 of this
Report of business net interest revenue on a taxable-equivalent basis. Note 23 presents results of businesses for 2015, 2014 and
2013.
The PNC Financial Services Group, Inc. – Form 10-K 51