PNC Bank 2015 Annual Report Download - page 70
Download and view the complete annual report
Please find page 70 of the 2015 PNC Bank annual report below. You can navigate through the pages in the report by either clicking on the pages listed below, or by using the keyword search tool below to find specific information within the annual report.-
 1
1 -
2
-
3
-
4
-
5
-
6
-
7
-
8
-
9
-
10
-
11
-
12
-
13
-
14
-
15
-
16
-
17
-
18
-
19
-
20
-
21
-
22
-
23
-
24
-
25
-
26
-
27
-
28
-
29
-
30
-
31
-
32
-
33
-
34
-
35
-
36
-
37
-
38
-
39
-
40
-
41
-
42
-
43
-
44
-
45
-
46
-
47
-
48
-
49
-
50
-
51
-
52
-
53
-
54
-
55
-
56
-
57
-
58
-
59
-
 60
60 -
 61
61 -
 62
62 -
 63
63 -
 64
64 -
 65
65 -
 66
66 -
 67
67 -
 68
68 -
 69
69 -
 70
70 -
 71
71 -
 72
72 -
 73
73 -
 74
74 -
 75
75 -
 76
76 -
 77
77 -
 78
78 -
 79
79 -
 80
80 -
81
-
82
-
83
-
84
-
85
-
86
-
87
-
88
-
89
-
90
-
91
-
92
-
93
-
94
-
95
-
96
-
97
-
98
-
99
-
100
-
101
-
102
-
103
-
104
-
105
-
106
-
107
-
108
-
109
-
110
-
111
-
112
-
113
-
114
-
115
-
116
-
117
-
118
-
119
-
120
-
121
-
122
-
123
-
124
-
125
-
126
-
127
-
128
-
129
-
130
-
131
-
132
-
133
-
134
-
135
-
136
-
137
-
138
-
139
-
140
-
141
-
142
-
143
-
144
-
145
-
146
-
147
-
148
-
149
-
150
-
151
-
152
-
153
-
154
-
155
-
156
-
157
-
158
-
159
-
160
-
161
-
162
-
163
-
164
-
165
-
166
-
167
-
168
-
169
-
170
-
171
-
172
-
173
-
174
-
175
-
176
-
177
-
178
-
179
-
180
-
181
-
182
-
183
-
184
-
185
-
186
-
187
-
188
-
189
-
190
-
191
-
192
-
193
-
194
-
195
-
196
-
197
-
198
-
199
-
200
-
201
-
202
-
203
-
204
-
205
-
206
-
207
-
208
-
209
-
210
-
211
-
212
-
213
-
214
-
215
-
216
-
217
-
218
-
219
-
220
-
221
-
222
-
223
-
224
-
225
-
226
-
227
-
228
-
229
-
230
-
231
-
232
-
233
-
234
-
235
-
236
-
237
-
238
-
239
-
240
-
241
-
242
-
243
-
244
-
245
-
246
-
247
-
248
-
249
-
250
-
251
-
252
-
253
-
254
-
255
-
256
 |
 |

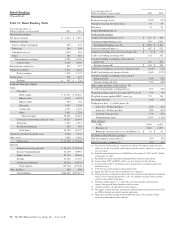
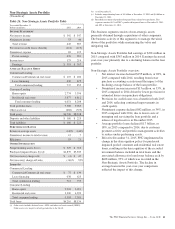
Retail Banking
(Unaudited)
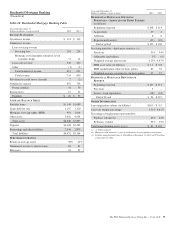
Table 21: Retail Banking Table
Year ended December 31
Dollars in millions, except as noted 2015 2014
I
NCOME
S
TATEMENT
Net interest income $ 4,226 $ 3,924
Noninterest income
Service charges on deposits 623 633
Brokerage 284 240
Consumer services 1,015 961
Other 301 291
Total noninterest income 2,223 2,125
Total revenue 6,449 6,049
Provision for credit losses 259 277
Noninterest expense 4,761 4,625
Pretax earnings 1,429 1,147
Income taxes 522 419
Earnings $ 907 $ 728
A
VERAGE
B
ALANCE
S
HEET
Loans
Consumer
Home equity $ 27,657 $ 28,852
Indirect auto 9,367 9,122
Indirect other 540 703
Education 6,307 7,208
Credit cards 4,527 4,364
Other 2,407 2,238
Total consumer 50,805 52,487
Commercial and commercial real estate 10,520 10,867
Floor plan 2,185 2,215
Residential mortgage 680 601
Total loans 64,190 66,170
Goodwill and other intangible assets 5,968 6,034
Other assets 3,082 2,842
Total assets $ 73,240 $ 75,046
Deposits
Noninterest-bearing demand $ 24,119 $ 22,134
Interest-bearing demand 36,189 33,992
Money market 54,576 50,263
Savings 14,358 11,847
Certificates of deposit 16,518 18,972
Total deposits 145,760 137,208
Other liabilities 609 469
Total liabilities $146,369 $137,677
Year ended December 31
Dollars in millions, except as noted 2015 2014
P
ERFORMANCE
R
ATIOS
Return on average assets 1.24% .97%
Noninterest income to total revenue 34 35
Efficiency 74 76
O
THER
I
NFORMATION
(a)
Credit-related statistics:
Commercial nonperforming assets $ 111 $ 139
Consumer nonperforming assets 934 1,059
Total nonperforming assets (b) $ 1,045 $ 1,198
Purchased impaired loans (c) $ 462 $ 575
Commercial lending net (recoveries) charge-offs $ (1) $ 31
Credit card lending net charge-offs 138 142
Consumer lending (excluding credit card) net
charge-offs 207 285
Total net charge-offs $ 344 $ 458
Commercial lending net (recovery) charge-off ratio (.01)% .24%
Credit Card lending net charge-off ratio 3.06% 3.25%
Consumer lending (excluding credit card) net
charge-off ratio .44% .58%
Total net charge-off ratio .54% .69%
Home equity portfolio credit statistics: (d)
% of first lien positions at origination (e) 56% 54%
Weighted-average loan-to-value ratios (LTVs) (e) (f) 73% 77%
Weighted-average updated FICO scores (g) 752 748
Net charge-off ratio .30% .54%
Delinquency data – % of total loans: (h)
Loans 30 – 59 days past due .18% .20%
Loans 60 – 89 days past due .09% .09%
Accruing loans past due .27% .29%
Nonperforming loans 2.96% 3.13%
Other statistics:
ATMs 8,956 8,605
Branches (i) 2,616 2,697
Brokerage account client assets (in billions) (j) $ 43 $ 43
Customer-related statistics (average):
Non-teller deposit transactions (k) 43% 35%
Digital consumer customers (l) 52% 46%
(a) Presented as of December 31, except for net charge-offs and net charge-off ratios,
which are for the year ended, and customer-related statistics, which are averages for
the year ended.
(b) Includes nonperforming loans of $1.0 billion at December 31, 2015 and $1.1 billion
at December 31, 2014.
(c) Recorded investment of purchased impaired loans related to acquisitions.
(d) Lien position, LTV and FICO statistics are based upon customer balances.
(e) Lien position and LTV calculations reflect management assumptions where data
limitations exist.
(f) LTV statistics are based upon current information.
(g) Represents FICO scores that are updated at least quarterly.
(h) Data based upon recorded investment. Past due amounts exclude purchased impaired
loans, even if contractually past due, as we are currently accreting interest income
over the expected life of the loans.
(i) Excludes satellite offices (e.g., drive-ups, electronic branches and retirement
centers) that provide limited products and/or services.
(j) Amounts include cash and money market balances.
(k) Percentage of total consumer and business banking deposit transactions processed at
an ATM or through our mobile banking application.
(l) Represents consumer checking relationships that process the majority of their
transactions through non-teller channels.
52 The PNC Financial Services Group, Inc. – Form 10-K