PNC Bank 2015 Annual Report Download - page 53
Download and view the complete annual report
Please find page 53 of the 2015 PNC Bank annual report below. You can navigate through the pages in the report by either clicking on the pages listed below, or by using the keyword search tool below to find specific information within the annual report.-
 1
1 -
2
-
3
-
4
-
5
-
6
-
7
-
8
-
9
-
10
-
11
-
12
-
13
-
14
-
15
-
16
-
17
-
18
-
19
-
20
-
21
-
22
-
23
-
24
-
25
-
26
-
27
-
28
-
29
-
30
-
31
-
32
-
33
-
34
-
35
-
36
-
37
-
38
-
39
-
40
-
41
-
42
-
 43
43 -
 44
44 -
 45
45 -
 46
46 -
 47
47 -
 48
48 -
 49
49 -
 50
50 -
 51
51 -
 52
52 -
 53
53 -
 54
54 -
 55
55 -
 56
56 -
 57
57 -
 58
58 -
 59
59 -
 60
60 -
 61
61 -
 62
62 -
 63
63 -
64
-
65
-
66
-
67
-
68
-
69
-
70
-
71
-
72
-
73
-
74
-
75
-
76
-
77
-
78
-
79
-
80
-
81
-
82
-
83
-
84
-
85
-
86
-
87
-
88
-
89
-
90
-
91
-
92
-
93
-
94
-
95
-
96
-
97
-
98
-
99
-
100
-
101
-
102
-
103
-
104
-
105
-
106
-
107
-
108
-
109
-
110
-
111
-
112
-
113
-
114
-
115
-
116
-
117
-
118
-
119
-
120
-
121
-
122
-
123
-
124
-
125
-
126
-
127
-
128
-
129
-
130
-
131
-
132
-
133
-
134
-
135
-
136
-
137
-
138
-
139
-
140
-
141
-
142
-
143
-
144
-
145
-
146
-
147
-
148
-
149
-
150
-
151
-
152
-
153
-
154
-
155
-
156
-
157
-
158
-
159
-
160
-
161
-
162
-
163
-
164
-
165
-
166
-
167
-
168
-
169
-
170
-
171
-
172
-
173
-
174
-
175
-
176
-
177
-
178
-
179
-
180
-
181
-
182
-
183
-
184
-
185
-
186
-
187
-
188
-
189
-
190
-
191
-
192
-
193
-
194
-
195
-
196
-
197
-
198
-
199
-
200
-
201
-
202
-
203
-
204
-
205
-
206
-
207
-
208
-
209
-
210
-
211
-
212
-
213
-
214
-
215
-
216
-
217
-
218
-
219
-
220
-
221
-
222
-
223
-
224
-
225
-
226
-
227
-
228
-
229
-
230
-
231
-
232
-
233
-
234
-
235
-
236
-
237
-
238
-
239
-
240
-
241
-
242
-
243
-
244
-
245
-
246
-
247
-
248
-
249
-
250
-
251
-
252
-
253
-
254
-
255
-
256
 |
 |

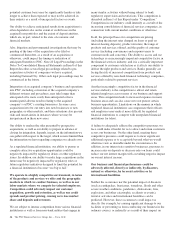
• Bolster our critical infrastructure and
streamline our core processes;
• Utilize technology to develop and deliver
products and services to our customers and
protect PNC’s systems and customer
information; and
• Sustain our expense management.
• Effectively managing capital and liquidity including:
• Continuing to maintain and grow our deposit
base as a low-cost stable funding source;
• Prudent liquidity and capital management to
meet evolving regulatory capital, capital
planning, stress testing and liquidity standards;
and
• Actions we take within the capital and other
financial markets.
• Managing credit risk in our portfolio;
• Our ability to manage and implement strategic
business objectives within the changing regulatory
environment;
• The impact of legal and regulatory-related
contingencies; and
• The appropriateness of reserves needed for critical
accounting estimates and related contingencies.
For additional information, see the Cautionary Statement
Regarding Forward-Looking Information section in this
Item 7 and Item 1A Risk Factors in this Report.
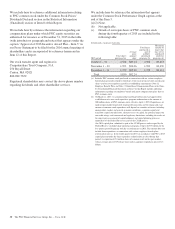
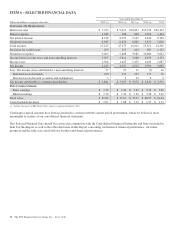
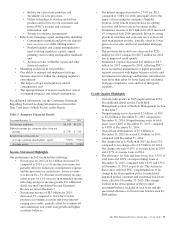
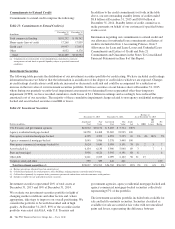
Table 1: Summary Financial Results
Year ended December 31 2015 2014
Net income (millions) $4,143 $4,207
Diluted earnings per common share from net
income $ 7.39 $ 7.30
Return from net income on:
Average common shareholders’ equity 9.50% 9.91%
Average assets 1.17% 1.28%
Income Statement Highlights
Our performance in 2015 included the following:
• Net income for 2015 of $4.1 billion decreased 2%
compared to 2014, as a 1% decline in revenue was
partially offset by reductions in noninterest expense
and the provision for credit losses. Lower revenue
was driven by a 3% decrease in net interest income,
offset in part by a 1% increase in noninterest income
reflecting strong fee income growth. For additional
detail, see the Consolidated Income Statement
Review section in this Item 7.
• Net interest income of $8.3 billion for 2015
decreased 3% compared to 2014 due to lower
purchase accounting accretion and lower interest-
earning asset yields, partially offset by commercial
and commercial real estate loan growth and higher
securities balances.
• Net interest margin decreased to 2.74% for 2015
compared to 3.08% for 2014, principally due to the
impact of increasing the company’s liquidity
position, lower benefit from purchase accounting
accretion, and lower loan and securities yields.
• Noninterest income of $6.9 billion for 2015 increased
1% compared with 2014, primarily driven by strong
growth in consumer and corporate services fees and
asset management revenue, partially offset by lower
gains on asset sales and lower residential mortgage
revenue.
• The provision for credit losses decreased to $255
million for 2015 compared to $273 million for 2014
due to improved credit quality.
• Noninterest expense decreased $25 million to $9.5
billion for 2015 compared to 2014, reflecting PNC’s
focus on expense management as higher personnel
expense associated with higher business activity and
investments in technology and business infrastructure
were more than offset by lower legal and residential
mortgage compliance costs and lower third party
expenses.
Credit Quality Highlights
• Overall credit quality in 2015 improved from 2014.
For additional detail, see the Credit Risk
Management portion of the Risk Management section
of this Item 7.
• Nonperforming assets decreased $.5 billion, or 16%,
to $2.4 billion at December 31, 2015 compared to
December 31, 2014. Nonperforming assets to total
assets were 0.68% at December 31, 2015, compared
to 0.83% at December 31, 2014.
• Overall loan delinquencies of $1.6 billion at
December 31, 2015 decreased $.3 billion, or 16%,
compared with December 31, 2014.
• Net charge-offs of $.4 billion in 2015 declined 27%
compared to net charge-offs of $.5 billion for 2014.
Net charge-offs were 0.19% of average loans in 2015
and 0.27% of average loans in 2014.
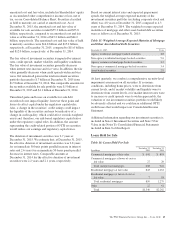
• The allowance for loan and lease losses was 1.32% of
total loans and 128% of nonperforming loans at
December 31, 2015, compared with 1.63% and 133%
at December 31, 2014, respectively. The decline in
these ratios reflected PNC’s implementation of its
change in the derecognition policy for purchased
impaired pooled consumer and residential real estate
loans, effective December 31, 2015. This change
resulted in the derecognition of the recorded
investment balance included in total loans and the
associated allowance for loan losses balance each by
$468 million.
The PNC Financial Services Group, Inc. – Form 10-K 35