PNC Bank 2015 Annual Report Download - page 239
Download and view the complete annual report
Please find page 239 of the 2015 PNC Bank annual report below. You can navigate through the pages in the report by either clicking on the pages listed below, or by using the keyword search tool below to find specific information within the annual report.-
 1
1 -
2
-
3
-
4
-
5
-
6
-
7
-
8
-
9
-
10
-
11
-
12
-
13
-
14
-
15
-
16
-
17
-
18
-
19
-
20
-
21
-
22
-
23
-
24
-
25
-
26
-
27
-
28
-
29
-
30
-
31
-
32
-
33
-
34
-
35
-
36
-
37
-
38
-
39
-
40
-
41
-
42
-
43
-
44
-
45
-
46
-
47
-
48
-
49
-
50
-
51
-
52
-
53
-
54
-
55
-
56
-
57
-
58
-
59
-
60
-
61
-
62
-
63
-
64
-
65
-
66
-
67
-
68
-
69
-
70
-
71
-
72
-
73
-
74
-
75
-
76
-
77
-
78
-
79
-
80
-
81
-
82
-
83
-
84
-
85
-
86
-
87
-
88
-
89
-
90
-
91
-
92
-
93
-
94
-
95
-
96
-
97
-
98
-
99
-
100
-
101
-
102
-
103
-
104
-
105
-
106
-
107
-
108
-
109
-
110
-
111
-
112
-
113
-
114
-
115
-
116
-
117
-
118
-
119
-
120
-
121
-
122
-
123
-
124
-
125
-
126
-
127
-
128
-
129
-
130
-
131
-
132
-
133
-
134
-
135
-
136
-
137
-
138
-
139
-
140
-
141
-
142
-
143
-
144
-
145
-
146
-
147
-
148
-
149
-
150
-
151
-
152
-
153
-
154
-
155
-
156
-
157
-
158
-
159
-
160
-
161
-
162
-
163
-
164
-
165
-
166
-
167
-
168
-
169
-
170
-
171
-
172
-
173
-
174
-
175
-
176
-
177
-
178
-
179
-
180
-
181
-
182
-
183
-
184
-
185
-
186
-
187
-
188
-
189
-
190
-
191
-
192
-
193
-
194
-
195
-
196
-
197
-
198
-
199
-
200
-
201
-
202
-
203
-
204
-
205
-
206
-
207
-
208
-
209
-
210
-
211
-
212
-
213
-
214
-
215
-
216
-
217
-
218
-
219
-
220
-
221
-
222
-
223
-
224
-
225
-
226
-
227
-
228
-
 229
229 -
 230
230 -
 231
231 -
 232
232 -
 233
233 -
 234
234 -
 235
235 -
 236
236 -
 237
237 -
 238
238 -
 239
239 -
 240
240 -
 241
241 -
 242
242 -
 243
243 -
 244
244 -
 245
245 -
 246
246 -
 247
247 -
 248
248 -
 249
249 -
250
-
251
-
252
-
253
-
254
-
255
-
256
 |
 |
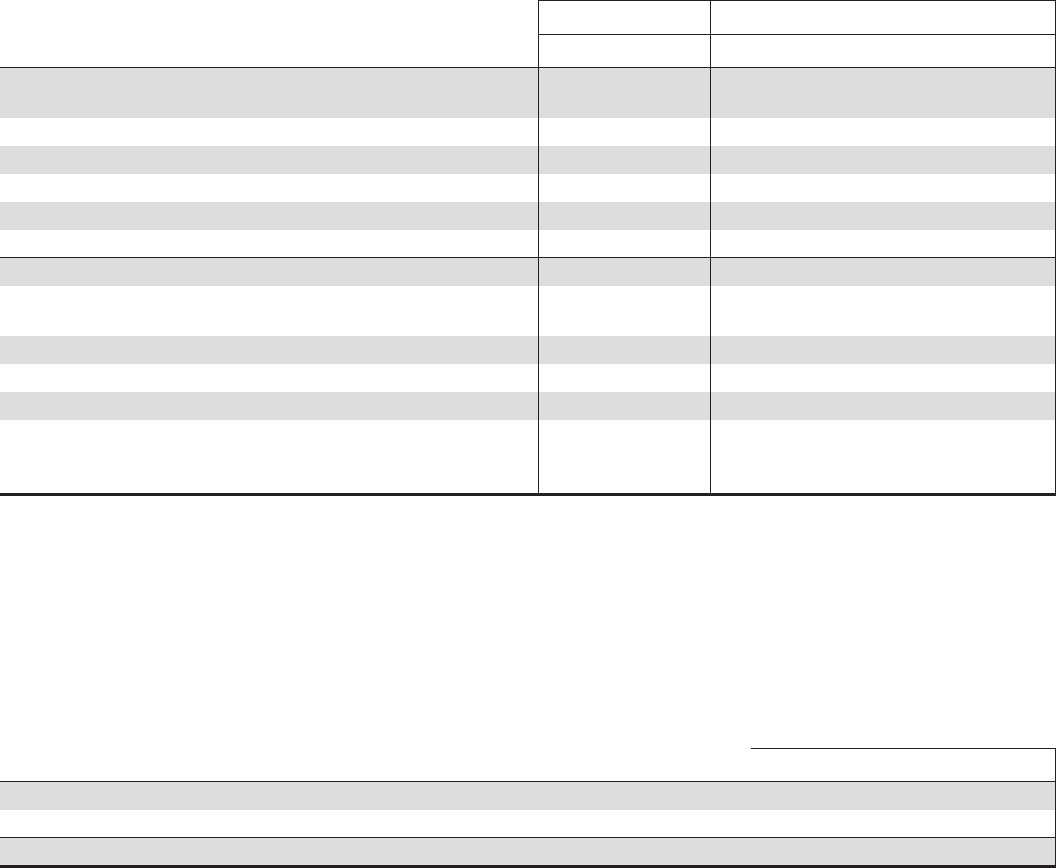
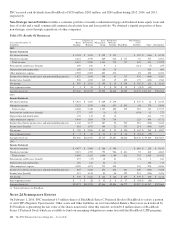
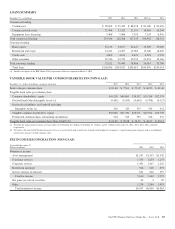
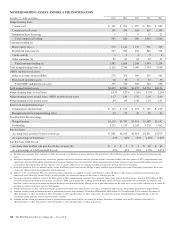
TRANSITIONAL BASEL III AND PRO FORMA FULLY PHASED-IN BASEL III COMMON EQUITY TIER 1
CAPITAL RATIOS – 2012-2014 PERIODS
PNC’s regulatory risk-based capital ratios in 2014 were based on the definitions of, and deductions from, regulatory capital under
the Basel III rules (as such definitions and deductions were phased-in for 2014) and Basel I risk-weighted assets (but subject to
certain adjustments as defined by the Basel III rules). We refer to the 2014 capital ratios calculated using these phased-in Basel III
provisions and Basel I risk-weighted assets as the 2014 Transitional Basel III ratios.
2014 Transitional
Basel III Pro forma Fully Phased-In Basel III (a) (b)
Dollars in millions
December 31
2014
December 31
2014
December 31
2013
December 31
2012
Common stock, related surplus and retained earnings, net of treasury
stock $ 40,103 $ 40,103 $ 38,031 $ 34,579
Less regulatory capital adjustments:
Goodwill and disallowed intangibles, net of deferred tax liabilities (8,939) (9,276) (9,321) (9,445)
Basel III total threshold deductions (212) (1,081) (1,386) (2,330)
Accumulated other comprehensive income (c) 40 201 196 276
All other adjustments (63) (121) (64) (579)
Estimated Basel III Common equity Tier 1 capital $ 30,929 $ 29,826 $ 27,456 $ 22,501
Estimated Basel I risk-weighted assets calculated in accordance with
transition rules (d) $284,018 N/A N/A N/A
Estimated Basel III standardized approach risk-weighted assets (e) N/A $298,786 $291,977 $ N/A
Estimated Basel III advanced approaches risk-weighted assets (f) N/A $285,870 $290,080 $301,006
Estimated Basel III Common equity Tier 1 capital ratio 10.9% 10.0% 9.4% 7.5%
Risk weight and associated rules utilized
Basel I (with 2014
transition
adjustments) Standardized Advanced
(a) PNC utilizes the pro forma fully phased-in Basel III capital ratios to assess its capital position (without the benefit of phase-ins), including comparison to similar estimates made by
other financial institutions.
(b) Basel III capital ratios and estimates may be impacted by additional regulatory guidance and, in the case of those ratios calculated using the advanced approaches, may be subject to
variability based on the ongoing evolution, validation and regulatory approval of PNC’s models that are integral to the calculation of advanced approaches risk-weighted assets as
PNC moves through the parallel run process.
(c) Represents net adjustments related to accumulated other comprehensive income for securities currently and previously held as available for sale, as well as pension and other
postretirement plans.
(d) Includes credit and market risk-weighted assets.
(e) Basel III standardized approach risk-weighted assets were estimated based on the Basel III standardized approach rules and include credit and market risk-weighted assets.
(f) Basel III advanced approaches risk-weighted assets were estimated based on the Basel III advanced approaches rules, and include credit, market and operational risk-weighted assets.
BASEL I TIER 1 COMMON CAPITAL RATIO (a) (b)
Dollars in millions
December 31
2013
December 31
2012
December 31
2011
Basel I Tier 1 common capital $ 28,484 $ 24,951 $ 23,732
Basel I risk-weighted assets 272,169 260,847 230,705
Basel I Tier 1 common capital ratio 10.5% 9.6% 10.3%
(a) Effective January 1, 2014, the Basel I Tier 1 common capital ratio no longer applies to PNC (except for stress testing purposes). Our 2013 Form 10-K included additional information
regarding our Basel I capital ratios.
(b) Amounts have not been updated to reflect the first quarter 2014 adoption of ASU 2014-01 related to investments in low income housing tax credits.
The PNC Financial Services Group, Inc. – Form 10-K 221