PNC Bank 2015 Annual Report Download - page 109
Download and view the complete annual report
Please find page 109 of the 2015 PNC Bank annual report below. You can navigate through the pages in the report by either clicking on the pages listed below, or by using the keyword search tool below to find specific information within the annual report.-
 1
1 -
2
-
3
-
4
-
5
-
6
-
7
-
8
-
9
-
10
-
11
-
12
-
13
-
14
-
15
-
16
-
17
-
18
-
19
-
20
-
21
-
22
-
23
-
24
-
25
-
26
-
27
-
28
-
29
-
30
-
31
-
32
-
33
-
34
-
35
-
36
-
37
-
38
-
39
-
40
-
41
-
42
-
43
-
44
-
45
-
46
-
47
-
48
-
49
-
50
-
51
-
52
-
53
-
54
-
55
-
56
-
57
-
58
-
59
-
60
-
61
-
62
-
63
-
64
-
65
-
66
-
67
-
68
-
69
-
70
-
71
-
72
-
73
-
74
-
75
-
76
-
77
-
78
-
79
-
80
-
81
-
82
-
83
-
84
-
85
-
86
-
87
-
88
-
89
-
90
-
91
-
92
-
93
-
94
-
95
-
96
-
97
-
98
-
 99
99 -
 100
100 -
 101
101 -
 102
102 -
 103
103 -
 104
104 -
 105
105 -
 106
106 -
 107
107 -
 108
108 -
 109
109 -
 110
110 -
 111
111 -
 112
112 -
 113
113 -
 114
114 -
 115
115 -
 116
116 -
 117
117 -
 118
118 -
 119
119 -
120
-
121
-
122
-
123
-
124
-
125
-
126
-
127
-
128
-
129
-
130
-
131
-
132
-
133
-
134
-
135
-
136
-
137
-
138
-
139
-
140
-
141
-
142
-
143
-
144
-
145
-
146
-
147
-
148
-
149
-
150
-
151
-
152
-
153
-
154
-
155
-
156
-
157
-
158
-
159
-
160
-
161
-
162
-
163
-
164
-
165
-
166
-
167
-
168
-
169
-
170
-
171
-
172
-
173
-
174
-
175
-
176
-
177
-
178
-
179
-
180
-
181
-
182
-
183
-
184
-
185
-
186
-
187
-
188
-
189
-
190
-
191
-
192
-
193
-
194
-
195
-
196
-
197
-
198
-
199
-
200
-
201
-
202
-
203
-
204
-
205
-
206
-
207
-
208
-
209
-
210
-
211
-
212
-
213
-
214
-
215
-
216
-
217
-
218
-
219
-
220
-
221
-
222
-
223
-
224
-
225
-
226
-
227
-
228
-
229
-
230
-
231
-
232
-
233
-
234
-
235
-
236
-
237
-
238
-
239
-
240
-
241
-
242
-
243
-
244
-
245
-
246
-
247
-
248
-
249
-
250
-
251
-
252
-
253
-
254
-
255
-
256
 |
 |

Other Equity Investments
We also have certain other equity investments, the majority of
which represent investments in affiliated and non-affiliated
funds with both traditional and alternative investment
strategies. The economic values could be driven by either the
fixed-income market or the equity markets, or both. Given the
nature of these investments, if market conditions affecting
their valuation were to worsen, we could incur future losses.
Net gains related to these investments were not significant
during 2015 and 2014.
Our unfunded commitments related to other investments at
December 31, 2015 and December 31, 2014 were not
significant.
Impact of Inflation
Our assets and liabilities are primarily financial in nature and
typically have varying maturity dates. Accordingly, future
changes in prices do not affect the obligations to pay or
receive fixed and determinable amounts of money. However,
during periods of inflation, there may be a subsequent impact
affecting certain fixed costs or expenses, an erosion of
consumer and customer purchasing power, and fluctuations in
the need or demand for our products and services. Should
significant levels of inflation occur, our business could
potentially be impacted by, among other things, reducing our
tolerance for extending credit or causing us to incur additional
credit losses resulting from possible increased default rates.
Financial Derivatives
We use a variety of financial derivatives as part of the overall
asset and liability risk management process to help manage
exposure to market and credit risk inherent in our business
activities. Substantially all such instruments are used to
manage risk related to changes in interest rates. Interest rate
swaps, interest rate caps and floors, swaptions, options,
forwards and futures contracts are the primary instruments we
use for interest rate risk management. We also enter into
derivatives with customers to facilitate their risk management
activities.
Financial derivatives involve, to varying degrees, market and
credit risk. Periodic cash payments are exchanged for interest
rate swaps, options and future contracts. Premiums are also
exchanged for options contracts. Therefore, cash requirements
and exposure to credit risk are significantly less than the
notional amount on these instruments.
Further information on our financial derivatives is presented
in Note 1 Accounting Policies, Note 7 Fair Value and Note 14
Financial Derivatives in the Notes To Consolidated Financial
Statements in Item 8 of this Report, which is incorporated here
by reference.
Not all elements of market and credit risk are addressed
through the use of financial derivatives, and such instruments
may be ineffective for their intended purposes due to
unanticipated market changes, among other reasons.
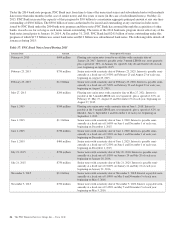
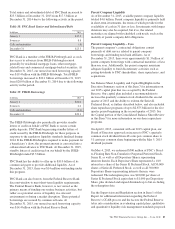
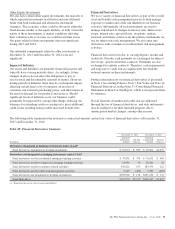
The following table summarizes the notional or contractual amounts and net fair value of financial derivatives at December 31,
2015 and December 31, 2014.
Table 49: Financial Derivatives Summary
December 31, 2015 December 31, 2014
In millions
Notional/
Contractual
Amount
Net Fair
Value (a)
Notional/
Contractual
Amount
Net Fair
Value (a)
Derivatives designated as hedging instruments under GAAP
Total derivatives designated as hedging instruments $ 52,074 $ 985 $ 49,061 $1,075
Derivatives not designated as hedging instruments under GAAP
Total derivatives used for residential mortgage banking activities $ 73,891 $ 376 $ 76,102 $ 409
Total derivatives used for commercial mortgage banking activities 24,091 36 26,290 26
Total derivatives used for customer-related activities 192,621 151 183,474 122
Total derivatives used for other risk management activities 5,299 (409) 5,390 (425)
Total derivatives not designated as hedging instruments $295,902 $ 154 $291,256 $ 132
Total Derivatives $347,976 $1,139 $340,317 $1,207
(a) Represents the net fair value of assets and liabilities.
The PNC Financial Services Group, Inc. – Form 10-K 91