PNC Bank 2015 Annual Report Download - page 196
Download and view the complete annual report
Please find page 196 of the 2015 PNC Bank annual report below. You can navigate through the pages in the report by either clicking on the pages listed below, or by using the keyword search tool below to find specific information within the annual report.-
 1
1 -
2
-
3
-
4
-
5
-
6
-
7
-
8
-
9
-
10
-
11
-
12
-
13
-
14
-
15
-
16
-
17
-
18
-
19
-
20
-
21
-
22
-
23
-
24
-
25
-
26
-
27
-
28
-
29
-
30
-
31
-
32
-
33
-
34
-
35
-
36
-
37
-
38
-
39
-
40
-
41
-
42
-
43
-
44
-
45
-
46
-
47
-
48
-
49
-
50
-
51
-
52
-
53
-
54
-
55
-
56
-
57
-
58
-
59
-
60
-
61
-
62
-
63
-
64
-
65
-
66
-
67
-
68
-
69
-
70
-
71
-
72
-
73
-
74
-
75
-
76
-
77
-
78
-
79
-
80
-
81
-
82
-
83
-
84
-
85
-
86
-
87
-
88
-
89
-
90
-
91
-
92
-
93
-
94
-
95
-
96
-
97
-
98
-
99
-
100
-
101
-
102
-
103
-
104
-
105
-
106
-
107
-
108
-
109
-
110
-
111
-
112
-
113
-
114
-
115
-
116
-
117
-
118
-
119
-
120
-
121
-
122
-
123
-
124
-
125
-
126
-
127
-
128
-
129
-
130
-
131
-
132
-
133
-
134
-
135
-
136
-
137
-
138
-
139
-
140
-
141
-
142
-
143
-
144
-
145
-
146
-
147
-
148
-
149
-
150
-
151
-
152
-
153
-
154
-
155
-
156
-
157
-
158
-
159
-
160
-
161
-
162
-
163
-
164
-
165
-
166
-
167
-
168
-
169
-
170
-
171
-
172
-
173
-
174
-
175
-
176
-
177
-
178
-
179
-
180
-
181
-
182
-
183
-
184
-
185
-
 186
186 -
 187
187 -
 188
188 -
 189
189 -
 190
190 -
 191
191 -
 192
192 -
 193
193 -
 194
194 -
 195
195 -
 196
196 -
 197
197 -
 198
198 -
 199
199 -
 200
200 -
 201
201 -
 202
202 -
 203
203 -
 204
204 -
 205
205 -
 206
206 -
207
-
208
-
209
-
210
-
211
-
212
-
213
-
214
-
215
-
216
-
217
-
218
-
219
-
220
-
221
-
222
-
223
-
224
-
225
-
226
-
227
-
228
-
229
-
230
-
231
-
232
-
233
-
234
-
235
-
236
-
237
-
238
-
239
-
240
-
241
-
242
-
243
-
244
-
245
-
246
-
247
-
248
-
249
-
250
-
251
-
252
-
253
-
254
-
255
-
256
 |
 |

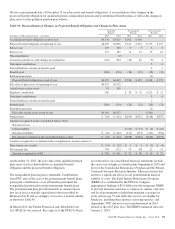
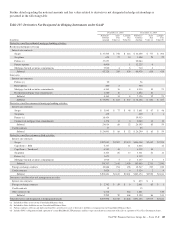
There were no options granted in 2013 where the grant date fair value exceeded the market value. The following table represents
the stock option activity for 2015.
Table 107: Stock Option Rollforward
PNC
PNC Options
Converted From
National City Total
Year ended December 31, 2015
In thousands, except weighted-average data Shares
Weighted-
Average
Exercise
Price Shares
Weighted-
Average
Exercise
Price Shares
Weighted-
Average
Exercise
Price
Weighted-
Average
Remaining
Contractual
Life
Aggregate
Intrinsic
Value
Outstanding, January 1 6,701 $56.41 343 $585.23 7,044 $ 82.17
Granted (a)
Exercised (1,741) 59.18 (1,741) 59.18
Cancelled (29) 44.61 (100) 738.18 (129) 580.37
Outstanding, December 31 4,931 $55.50 243 $522.54 5,174 $ 77.47 3.2 years $196,292
Vested and expected to vest, December 31 (b) 4,931 $55.50 243 $522.54 5,174 $ 77.47 3.2 years $196,286
Exercisable, December 31 4,883 $55.42 243 $522.54 5,126 $ 77.60 3.2 years $194,782
(a) PNC did not grant any stock options in 2015 and 2014.
(b) Adjusted for estimated forfeitures on unvested options.
To determine stock-based compensation expense, the grant
date fair value is applied to the options granted with a
reduction for estimated forfeitures. We recognize
compensation expense for stock options on a straight-line
basis over the specified vesting period.
At December 31, 2014 and 2013, options for 6,810,000 and
10,204,000 shares of common stock were exercisable at a
weighted-average price of $82.86 and $89.46, respectively.
The total intrinsic value of options exercised during 2015,
2014 and 2013 was $62 million, $90 million and $86 million,
respectively.
Cash received from option exercises under all Incentive Plans
for 2015, 2014 and 2013 was approximately $103 million,
$215 million and $208 million, respectively. The tax benefit
realized from option exercises under all Incentive Plans for
2015, 2014 and 2013 was approximately $23 million, $33
million and $31 million, respectively.
Shares of common stock available during the next year for the
granting of options and other awards under the Incentive Plans
were approximately 14 million at December 31, 2015. Total
shares of PNC common stock authorized for future issuance
under equity compensation plans totaled approximately
15 million shares at December 31, 2015, which includes
shares available for issuance under the Incentive Plans and the
Employee Stock Purchase Plan (ESPP) as described below.
During 2015, we issued approximately 1.2 million common
shares from treasury stock in connection with stock option
exercise activity. As with past exercise activity, we currently
intend to utilize primarily treasury stock for any future stock
option exercises.
Awards granted to non-employee directors in 2015, 2014 and
2013 include 18,048, 21,490 and 27,076 deferred stock units,
respectively, awarded under the Outside Directors Deferred
Stock Unit Plan. A deferred stock unit is a phantom share of
our common stock, which is accounted for as a liability until
such awards are paid to the participants in cash. As there are
no vesting or service requirements on these awards, total
compensation expense is recognized in full for these awards
on the date of grant.
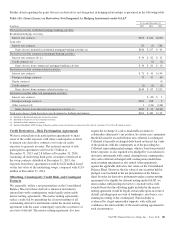
Incentive/Performance Unit Awards and Restricted
Share/Restricted Share Unit Awards
The fair value of nonvested incentive/performance unit awards
and restricted share/restricted share unit awards is initially
determined based on prices not less than the market value of
our common stock on the date of grant. The value of certain
incentive/performance unit awards is subsequently remeasured
based on the achievement of one or more financial and other
performance goals. The Personnel and Compensation
Committee (“P&CC”) of the Board of Directors approves the
final award payout with respect to certain incentive/
performance unit awards. These awards primarily have either
a three-year or a four-year performance period and are payable
in either stock or a combination of stock and cash. Restricted
share/restricted share unit awards have various vesting periods
generally ranging from 3 years to 5 years.
Beginning in 2013, we incorporated several enhanced risk-
related performance changes to certain long-term incentive
compensation programs. In addition to achieving certain
financial performance metrics on both an absolute basis and
relative to our peers, final payout amounts will be subject to
reduction if PNC fails to meet certain risk-related performance
metrics as specified in the award agreements. However, the
P&CC has the discretion to waive any or all of this reduction
under certain circumstances.
178 The PNC Financial Services Group, Inc. – Form 10-K