PNC Bank 2015 Annual Report Download - page 195
Download and view the complete annual report
Please find page 195 of the 2015 PNC Bank annual report below. You can navigate through the pages in the report by either clicking on the pages listed below, or by using the keyword search tool below to find specific information within the annual report.-
 1
1 -
2
-
3
-
4
-
5
-
6
-
7
-
8
-
9
-
10
-
11
-
12
-
13
-
14
-
15
-
16
-
17
-
18
-
19
-
20
-
21
-
22
-
23
-
24
-
25
-
26
-
27
-
28
-
29
-
30
-
31
-
32
-
33
-
34
-
35
-
36
-
37
-
38
-
39
-
40
-
41
-
42
-
43
-
44
-
45
-
46
-
47
-
48
-
49
-
50
-
51
-
52
-
53
-
54
-
55
-
56
-
57
-
58
-
59
-
60
-
61
-
62
-
63
-
64
-
65
-
66
-
67
-
68
-
69
-
70
-
71
-
72
-
73
-
74
-
75
-
76
-
77
-
78
-
79
-
80
-
81
-
82
-
83
-
84
-
85
-
86
-
87
-
88
-
89
-
90
-
91
-
92
-
93
-
94
-
95
-
96
-
97
-
98
-
99
-
100
-
101
-
102
-
103
-
104
-
105
-
106
-
107
-
108
-
109
-
110
-
111
-
112
-
113
-
114
-
115
-
116
-
117
-
118
-
119
-
120
-
121
-
122
-
123
-
124
-
125
-
126
-
127
-
128
-
129
-
130
-
131
-
132
-
133
-
134
-
135
-
136
-
137
-
138
-
139
-
140
-
141
-
142
-
143
-
144
-
145
-
146
-
147
-
148
-
149
-
150
-
151
-
152
-
153
-
154
-
155
-
156
-
157
-
158
-
159
-
160
-
161
-
162
-
163
-
164
-
165
-
166
-
167
-
168
-
169
-
170
-
171
-
172
-
173
-
174
-
175
-
176
-
177
-
178
-
179
-
180
-
181
-
182
-
183
-
184
-
 185
185 -
 186
186 -
 187
187 -
 188
188 -
 189
189 -
 190
190 -
 191
191 -
 192
192 -
 193
193 -
 194
194 -
 195
195 -
 196
196 -
 197
197 -
 198
198 -
 199
199 -
 200
200 -
 201
201 -
 202
202 -
 203
203 -
 204
204 -
 205
205 -
206
-
207
-
208
-
209
-
210
-
211
-
212
-
213
-
214
-
215
-
216
-
217
-
218
-
219
-
220
-
221
-
222
-
223
-
224
-
225
-
226
-
227
-
228
-
229
-
230
-
231
-
232
-
233
-
234
-
235
-
236
-
237
-
238
-
239
-
240
-
241
-
242
-
243
-
244
-
245
-
246
-
247
-
248
-
249
-
250
-
251
-
252
-
253
-
254
-
255
-
256
 |
 |

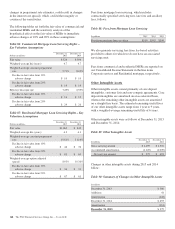
The ISP is a 401(k) Plan and includes an employee stock
ownership (ESOP) feature. Employee contributions are
invested in a number of investment options, including pre
mixed portfolios and individual core funds, available under
the ISP at the direction of the employee. Although employees
were also historically permitted to direct the investment of
their contributions into the PNC common stock fund, this fund
was frozen to future investments of such contributions
effective January 1, 2010. All shares of PNC common stock
held by the ISP are part of the ESOP. Effective January 1,
2011, employer matching contributions were made in cash.
We also maintain a nonqualified supplemental savings plan
for certain employees, known as The PNC Financial Services
Group, Inc. Supplemental Incentive Savings Plan. Effective
January 1, 2012, the Supplemental Incentive Savings Plan was
frozen to new participants and for any deferrals of amounts
earned on or after such date. It was replaced by a new plan
called The PNC Financial Services Group, Inc. Deferred
Compensation and Incentive Plan.
N
OTE
13 S
TOCK
B
ASED
C
OMPENSATION
P
LANS
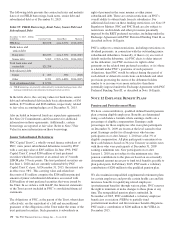
We have long-term incentive award plans (Incentive Plans)
that provide for the granting of incentive stock options,
nonqualified stock options, stock appreciation rights, incentive
shares/performance units, restricted shares, restricted share
units, other share-based awards and dollar-denominated
awards to executives and, other than incentive stock options,
to non-employee directors. Certain Incentive Plan awards may
be paid in stock, cash or a combination of stock and cash. We
typically grant a substantial portion of our stock-based
compensation awards during the first quarter of the year. As of
December 31, 2015, no stock appreciation rights were
outstanding.
Total compensation expense recognized related to all share-
based payment arrangements during 2015, 2014 and 2013 was
approximately $173 million, $181 million and $154 million,
respectively. The total tax benefit recognized related to
compensation expense on all share-based payment
arrangements during 2015, 2014 and 2013 was approximately
$63 million, $66 million and $56 million, respectively. At
December 31, 2015, there was $191 million of unamortized
share-based compensation expense related to nonvested equity
compensation arrangements granted under the Incentive Plans.
This unamortized cost is expected to be recognized as expense
over a period of no longer than five years.
Nonqualified Stock Options
Beginning in 2014, PNC discontinued the use of stock options
as a standard element of our long-term equity incentive
compensation programs under our Incentive Plans and did not
grant any options in 2015 and 2014. Prior to 2014, options
were granted at exercise prices not less than the market value
of a share of common stock on the grant date. Generally,
options become exercisable in installments after the grant
date. No option can be exercised after 10 years from its grant
date. Payment of the option exercise price may be in cash or
by surrendering shares of common stock at market value on
the exercise date. The exercise price may also be paid by
using previously owned shares.
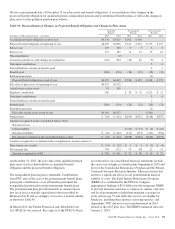
Option Pricing Assumptions
For purposes of computing stock option expense for grants
made in 2013, we estimated the fair value of stock options at
the grant date by using the Black-Scholes option pricing
model. Option pricing models require the use of numerous
assumptions, many of which are subjective.
We used the following assumptions in the Black-Scholes
option pricing model to determine 2013 grant date fair value:
• The risk-free interest rate is based on the U.S.
Treasury yield curve,
• The dividend yield is indicative of our current
dividend rate,
• Volatility is measured using the fluctuation in month-
end closing stock prices over a period which
corresponds with the average expected option life,
but in no case less than a five-year period, and
• The expected life represents the period of time that
options granted are expected to be outstanding and is
based on a weighted-average of historical option
activity.
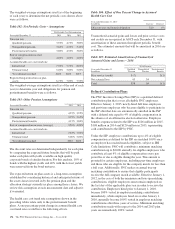
Table 106: Option Pricing Assumptions (a)
Weighted-average for the
year ended December 31 2013
Risk-free interest rate .9%
Dividend yield 2.5
Volatility 34.0
Expected life 6.5yrs.
Grant date fair value $ 16.35
(a) PNC did not grant any stock options in 2015 and 2014.
The PNC Financial Services Group, Inc. – Form 10-K 177