PNC Bank 2015 Annual Report Download - page 60
Download and view the complete annual report
Please find page 60 of the 2015 PNC Bank annual report below. You can navigate through the pages in the report by either clicking on the pages listed below, or by using the keyword search tool below to find specific information within the annual report.-
 1
1 -
2
-
3
-
4
-
5
-
6
-
7
-
8
-
9
-
10
-
11
-
12
-
13
-
14
-
15
-
16
-
17
-
18
-
19
-
20
-
21
-
22
-
23
-
24
-
25
-
26
-
27
-
28
-
29
-
30
-
31
-
32
-
33
-
34
-
35
-
36
-
37
-
38
-
39
-
40
-
41
-
42
-
43
-
44
-
45
-
46
-
47
-
48
-
49
-
 50
50 -
 51
51 -
 52
52 -
 53
53 -
 54
54 -
 55
55 -
 56
56 -
 57
57 -
 58
58 -
 59
59 -
 60
60 -
 61
61 -
 62
62 -
 63
63 -
 64
64 -
 65
65 -
 66
66 -
 67
67 -
 68
68 -
 69
69 -
 70
70 -
71
-
72
-
73
-
74
-
75
-
76
-
77
-
78
-
79
-
80
-
81
-
82
-
83
-
84
-
85
-
86
-
87
-
88
-
89
-
90
-
91
-
92
-
93
-
94
-
95
-
96
-
97
-
98
-
99
-
100
-
101
-
102
-
103
-
104
-
105
-
106
-
107
-
108
-
109
-
110
-
111
-
112
-
113
-
114
-
115
-
116
-
117
-
118
-
119
-
120
-
121
-
122
-
123
-
124
-
125
-
126
-
127
-
128
-
129
-
130
-
131
-
132
-
133
-
134
-
135
-
136
-
137
-
138
-
139
-
140
-
141
-
142
-
143
-
144
-
145
-
146
-
147
-
148
-
149
-
150
-
151
-
152
-
153
-
154
-
155
-
156
-
157
-
158
-
159
-
160
-
161
-
162
-
163
-
164
-
165
-
166
-
167
-
168
-
169
-
170
-
171
-
172
-
173
-
174
-
175
-
176
-
177
-
178
-
179
-
180
-
181
-
182
-
183
-
184
-
185
-
186
-
187
-
188
-
189
-
190
-
191
-
192
-
193
-
194
-
195
-
196
-
197
-
198
-
199
-
200
-
201
-
202
-
203
-
204
-
205
-
206
-
207
-
208
-
209
-
210
-
211
-
212
-
213
-
214
-
215
-
216
-
217
-
218
-
219
-
220
-
221
-
222
-
223
-
224
-
225
-
226
-
227
-
228
-
229
-
230
-
231
-
232
-
233
-
234
-
235
-
236
-
237
-
238
-
239
-
240
-
241
-
242
-
243
-
244
-
245
-
246
-
247
-
248
-
249
-
250
-
251
-
252
-
253
-
254
-
255
-
256
 |
 |

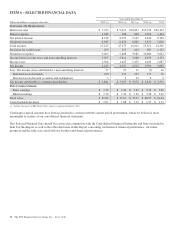
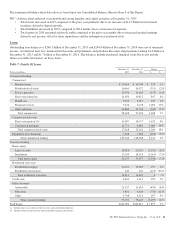
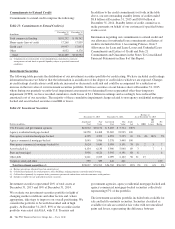
The increase in loans was the result of an increase in total
commercial lending driven by commercial real estate loans,
partially offset by a decline in consumer lending due to lower
home equity, education, and automobile loans.
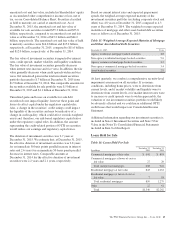
Loans represented 58% of total assets at December 31, 2015
and 59% at December 31, 2014. Commercial lending
represented 65% of the loan portfolio at December 31, 2015
and 63% at December 31, 2014. Consumer lending
represented 35% of the loan portfolio at December 31, 2015
and 37% at December 31, 2014.
Commercial real estate loans represented 13% of total loans at
December 31, 2015 and 11% of total loans at December 31,
2014 and represented 8% and 7% of total assets at
December 31, 2015 and December 31, 2014, respectively. See
the Credit Risk Management portion of the Risk Management
section of this Item 7 for additional information regarding our
loan portfolio.
Total loans above include purchased impaired loans of $3.5
billion, or 2% of total loans, at December 31, 2015, and $4.9
billion, or 2% of total loans, at December 31, 2014.
Our loan portfolio continued to be diversified among
numerous industries, types of businesses and consumers
across our principal geographic markets.
For the first quarter of 2016, we expect total loans to be stable
with the fourth quarter of 2015.
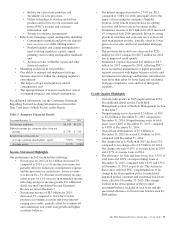
Allowance for Loan and Lease Losses (ALLL)
Information regarding our higher risk loans and ALLL is
included in the Credit Risk Management portion of the Risk
Management section of this Item 7 and Note 1 Accounting
Policies, Note 3 Asset Quality and Note 5 Allowances for
Loan and Lease Losses and Unfunded Loan Commitments and
Letters of Credit in our Notes To Consolidated Financial
Statements included in Item 8 of this Report.
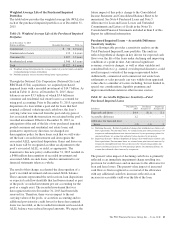
Purchase Accounting Accretion and Valuation of
Purchased Impaired Loans
Information related to purchase accounting accretion and
accretable yield for 2015 and 2014 follows. Additional
information on our policies for ALLL for purchased impaired
loans is provided in Note 1 Accounting Policies in the Notes
To Consolidated Financial Statements included in Item 8 of
this Report. A description of our purchased impaired loan
accounting and loan data is included in Note 4 Purchased
Loans in the Notes To Consolidated Financial Statements
included in Item 8 of this Report.
Table 8: Accretion – Purchased Impaired Loans
In millions 2015 2014
Accretion on purchased impaired loans
Scheduled accretion $ 360 $ 460
Reversal of contractual interest on impaired loans (217) (253)
Scheduled accretion net of contractual interest 143 207
Excess cash recoveries (a) 106 127
Total $ 249 $ 334
(a) Relates to excess cash recoveries for purchased impaired commercial loans.
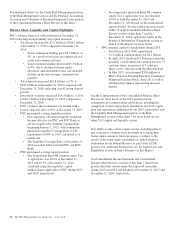
Table 9: Purchased Impaired Loans – Accretable Yield
In millions 2015 2014
January 1 $1,558 $2,055
Accretion (including excess cash recoveries) (466) (587)
Net reclassification to accretable from non-
accretable and other activity 226 208
Disposals (68) (118)
December 31 (a) $1,250 $1,558
(a) As of December 31, 2015, we estimate that the reversal of contractual interest on
purchased impaired loans will total approximately $0.7 billion in future periods.
This will offset the total net accretable interest in future interest income of $1.2
billion on purchased impaired loans.
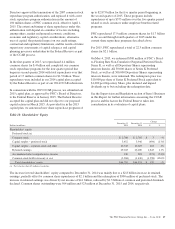
Information related to the valuation of purchased impaired loans at December 31, 2015 and December 31, 2014 follows.
Table 10: Valuation of Purchased Impaired Loans
December 31, 2015 December 31, 2014
Dollars in millions Balance Net Investment Balance Net Investment
Total purchased impaired loans:
Outstanding balance $3,933 $5,007
Recorded investment (a) $3,522 $4,858
Allowance for loan losses (a) (310) (872)
Net investment/Carrying value $3,212 82% $3,986 80%
(a) The December 31, 2015 amounts were impacted by the change in derecognition policy for purchased impaired pooled consumer and residential real estate loans as of December 31,
2015. For additional information, see the discussion below, as well as Note 4 Purchased Loans in the Notes To Consolidated Financial Statements in Item 8 of this Report.
At December 31, 2015, our largest individual purchased impaired loan had a recorded investment of $8 million. We currently
expect to collect total cash flows of $4.4 billion on purchased impaired loans, representing the $3.2 billion net investment at
December 31, 2015 and the accretable net interest of $1.2 billion shown in Table 9.
42 The PNC Financial Services Group, Inc. – Form 10-K